OPEN-SOURCE SCRIPT
已更新 TR High/Low meter
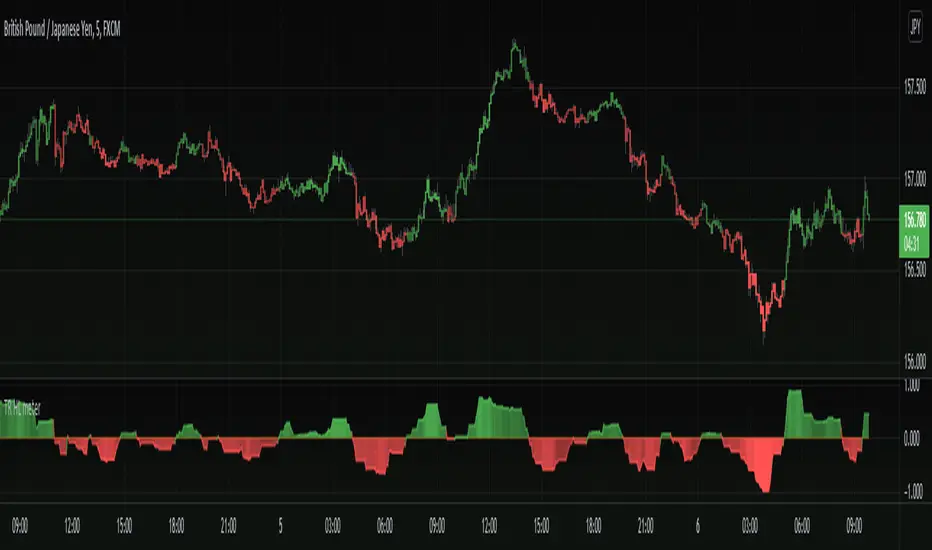
Interesting take for a velocity and trend analysis indicator, I call it The TR high/low meter.
First it will find the highest high and lowest low based on X bars back.
Now comes the twist, instead of storing these lowest or highest prices, we store the TR (true range) into the appropriate array (one array for lowest and one array for highest).
Finally, we sum up these two arrays for highest TR's and lowest TR's and subtract each other to get the difference, Hench, see who is stronger.
In the end we plot the difference into the indicator we have here.
The plot is colored with gradient color in which bright color emphasizes the movement is strong and weaker color emphasizes the movement is getting weaker.
Basically this indicator shows us the asset trend direction and strength. Awesome!
==Colors and Bar Colors==
Green: Up Trending
Light Green: Weakening up trend
Red: Down Trending.
Light Red: Weakening Down Trending.
==Notes==
Bar coloring is enabled on this chart!
Supports EMA smoothing (disabled by default)
Like if you like and Enjoy! Follow for more upcoming indicators/strategies: tradingview.com/u/dman103/
發行說明
Added alerts, Buy, Sell, and Natural (inside trade zone area)Added No trade zone range in which alerts will not trigger.
'No Trade zone' is visualized by white dots and borderlines.
The No-Trade zone is a zone where Buy and Sell alerts will NOT trigger (Note: disabled by default in settings).
Screenshot of 'no-trade zone':
發行說明
Update to version 6 of pinescript.Improved logic to one array instead of two arrays.
Added new plot to external filtering.
Added multi-time frame support.
Minor fixes.
開源腳本
本著TradingView的真正精神,此腳本的創建者將其開源,以便交易者可以查看和驗證其功能。向作者致敬!雖然您可以免費使用它,但請記住,重新發佈程式碼必須遵守我們的網站規則。
Appreciation of my work: paypal.me/dman103
All Premium indicators: algo.win
LIVE Stream - Pivot Points Algo: youtube.com/channel/UCFyqab-i0xb2jf-c18ufH0A/live
All Premium indicators: algo.win
LIVE Stream - Pivot Points Algo: youtube.com/channel/UCFyqab-i0xb2jf-c18ufH0A/live
免責聲明
這些資訊和出版物並不意味著也不構成TradingView提供或認可的金融、投資、交易或其他類型的意見或建議。請在使用條款閱讀更多資訊。