PROTECTED SOURCE SCRIPT
已更新 UTG - RSI
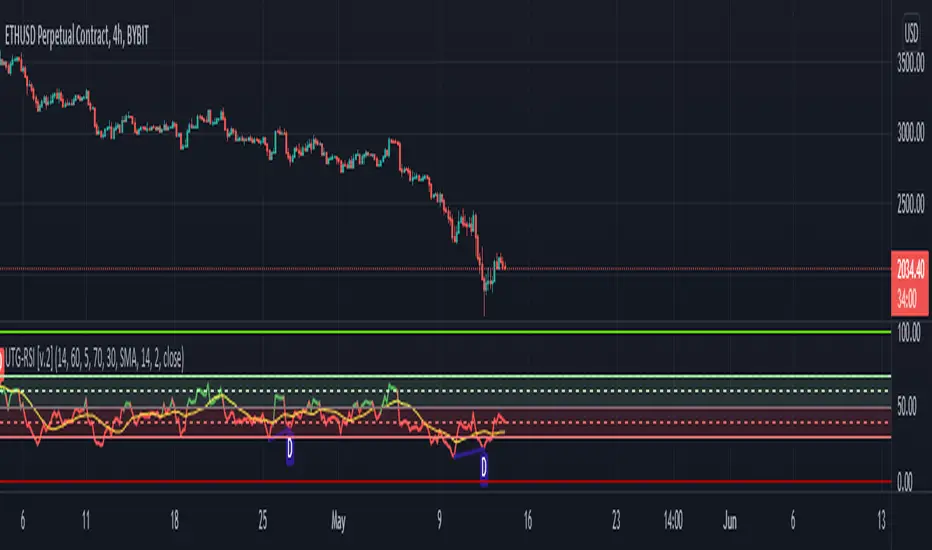
We've taken the RSI moving oscillator, given it the classic UTG flair & made it more useful.
We're always talking about how there are a few key levels on the RSI indicator that give us the indication of whether we are bullish or bearish.
- We've added those key levels into the RSI indicator.
- Added the 50 level as our key swing into the bearish or bullish territory.
- The RSI often uses the 50 level, to maintain a level of support or resistance and usually maintains this throughout its market cycle.
- Using the green and the red areas, this tool allows you to swiftly identify which market cycle the chart you're looking at is in.
- We'll be adding more functionality as times goes on!
Enjoy, it's free!
發行說明
The Relative Strength Index (RSI), developed by J. Welles Wilder, is a momentum oscillator that measures the speed and change of price movements. ADD- RSI divergence and this shows traders when price action and the RSI are no longer showing the same momentum. The RSI shows the magnitude of a price move in a specific timeframe. The RSI is one of the most popular oscillators used in technical analysis. A divergence looks at it in relation to the current price action. When RSI stops breaking out to higher highs during an uptrend in price or breaking down to lower lows when price is in a down trend then it is said to be an RSI divergence.發行說明
Added Alerts for All DivergencesAdded the ability to adjust the OB and OS levels and set Alerts for them
發行說明
Upgraded to version 5
Tidied up settings menu for ease of use
Added Moving Averages plots
受保護腳本
此腳本以閉源形式發佈。 不過,您可以自由使用,沒有任何限制 — 點擊此處了解更多。
免責聲明
這些資訊和出版物並非旨在提供,也不構成TradingView提供或認可的任何形式的財務、投資、交易或其他類型的建議或推薦。請閱讀使用條款以了解更多資訊。
受保護腳本
此腳本以閉源形式發佈。 不過,您可以自由使用,沒有任何限制 — 點擊此處了解更多。
免責聲明
這些資訊和出版物並非旨在提供,也不構成TradingView提供或認可的任何形式的財務、投資、交易或其他類型的建議或推薦。請閱讀使用條款以了解更多資訊。