PROTECTED SOURCE SCRIPT
已更新 © Investoz Volume/ATR/DailyRange/OHLC/Probability/Volatility
The relationship between returns, volatility and trading volume has interested financial economists and analysts for a long time.
Is there any dynamic relationship between trading volume, returns and volatility in the financial markets?
In recent financial studies, the linkage between return, volatility and trading volume is a central issue as it provides insights into the microstructure of financial markets. The price-volume relationship is seen as it is related to the role of information in price formation. Trading volume is defined as the number of shares traded each day and is an important indicator in technical analysis as it is used to measure the worth of stock price movement
either up or down.
Investors' motive to trade is solely dependent on their trading activity; it may be to speculate on market information or portfolios diversification for risk sharing, or else the need for liquidity. These different motives to trade are a result of processing different available information. In consequence, trading volume may originate from any of the investors who may have different information sets. As various studies reported, the information flow into the market is linked to the trading volume and volatility. Thus, since the stock price changes when new information arrives, there exists a relation between prices, volatility and trading volumes.
Significant efforts have been made, empirically and theoretically, on the phenomenon of stock price and volume relationship. Although the majority of those findings have confirmed the existence of positive contemporaneous relationship between trading volume and returns, the study of different stock markets have given mixed results about the causal return-volume relationship.
So, if you think that price and volume is important, maybe this indicator full of information around this topic may help you or make it easier in many ways.
Let me briefly guide you through.
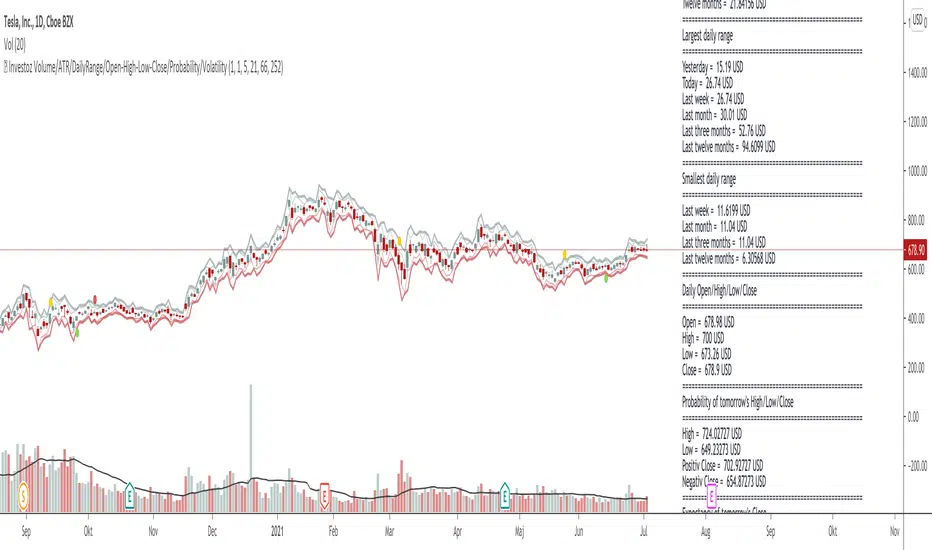
To the right you have all the information within a label directly on the chart. Inside the label you will see following information:
-Number of bars
-Volume
-Average true range
-Daily range
-OHLC
-Probability for tomorrow´s daily range
-Warning of increased volatility
In the chart, you will also see where the expected daily range is likely to be within, with high and low levels.
Finally, I like to say this:
I have put a lot of work into this script and let me know if you use the indicator and what you think of it. Also if it is of some help or maybe you who use it, have found something wrong that needs to be reviewed and changed or information that would be important to add?
Enjoy!
Is there any dynamic relationship between trading volume, returns and volatility in the financial markets?
In recent financial studies, the linkage between return, volatility and trading volume is a central issue as it provides insights into the microstructure of financial markets. The price-volume relationship is seen as it is related to the role of information in price formation. Trading volume is defined as the number of shares traded each day and is an important indicator in technical analysis as it is used to measure the worth of stock price movement
either up or down.
Investors' motive to trade is solely dependent on their trading activity; it may be to speculate on market information or portfolios diversification for risk sharing, or else the need for liquidity. These different motives to trade are a result of processing different available information. In consequence, trading volume may originate from any of the investors who may have different information sets. As various studies reported, the information flow into the market is linked to the trading volume and volatility. Thus, since the stock price changes when new information arrives, there exists a relation between prices, volatility and trading volumes.
Significant efforts have been made, empirically and theoretically, on the phenomenon of stock price and volume relationship. Although the majority of those findings have confirmed the existence of positive contemporaneous relationship between trading volume and returns, the study of different stock markets have given mixed results about the causal return-volume relationship.
So, if you think that price and volume is important, maybe this indicator full of information around this topic may help you or make it easier in many ways.
Let me briefly guide you through.
To the right you have all the information within a label directly on the chart. Inside the label you will see following information:
-Number of bars
-Volume
-Average true range
-Daily range
-OHLC
-Probability for tomorrow´s daily range
-Warning of increased volatility
In the chart, you will also see where the expected daily range is likely to be within, with high and low levels.
Finally, I like to say this:
I have put a lot of work into this script and let me know if you use the indicator and what you think of it. Also if it is of some help or maybe you who use it, have found something wrong that needs to be reviewed and changed or information that would be important to add?
Enjoy!
發行說明
Changed a misstake in the script that calculated probability of the High and Low for the next bar incorrect.發行說明
.發行說明
Updated the same issue.發行說明
Duplicate the names in the data window for High, Low, Positiv Close, Negative Close.發行說明
Some aesthetic changes have been made.發行說明
String update. 發行說明
I have made some color.new changes in the script. 受保護腳本
此腳本以閉源形式發佈。 不過,您可以自由使用,沒有任何限制 — 點擊此處了解更多。
免責聲明
這些資訊和出版物並非旨在提供,也不構成TradingView提供或認可的任何形式的財務、投資、交易或其他類型的建議或推薦。請閱讀使用條款以了解更多資訊。
免責聲明
這些資訊和出版物並非旨在提供,也不構成TradingView提供或認可的任何形式的財務、投資、交易或其他類型的建議或推薦。請閱讀使用條款以了解更多資訊。