OPEN-SOURCE SCRIPT
Vertical Lines 2
A vertical line plotting function is missing in Pinescript. This is another method to plot vertical line on a chart, and an improvement on my previous script "vertical lines" .

The script hacks the plotcandle function to display just the wicks without the body. This hack simulates a vertical line. The body of the candle is non-existing since the open and close are the same and its color is set to null. The wicks are abutting resulting in a continuous vertical line.
Drawbacks include inability to set width and transparency of the lines. The plotcandle function does not allow setting the width and transparency of the wicks. This feature would be desirable.
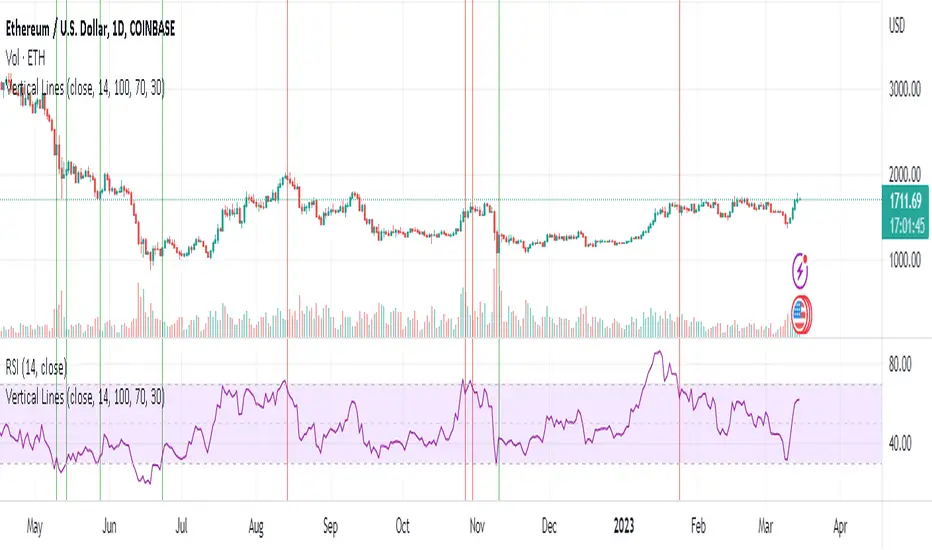
The crossing of the RSI of overbought and undersold zones is used as an example in this published script. Any indicator can be used and this script can be executed on any other indicator by using "add indicator" on the desired indicator, and selecting the indicator as the source. I added crossover lines on the plotted RSI as an example.
//////////////////////////////////////////////////////Breakdown of the script////////////////////////////////////////////////////////
The src input determines which price data is used for the highest value calculation. By default, it is set to the close price.
The length input determines the length of the RSI calculation. By default, it is set to 14.
The mult input determines the multiplier of the highest value that is used to determine the height of the vertical lines. By default, it is set to 100%, meaning the lines will reach the highest value in the dataset.
The top and bot inputs determine the overbought and oversold levels for the RSI. By default, they are set to 70 and 30, respectively.
The current_rsi and previous_rsi variables calculate the RSI values for the current bar and the previous bar, respectively.
The hi_value variable finds the highest value in the dataset, and the hi variable calculates the height of the vertical lines based on the highest value and the user-defined multiplier. The lo variable calculates the distance between the highest value and the current price data.
The uph, dnh, upl, and dnl variables determine the height and low of the vertical lines for when the RSI crosses overbought or oversold levels.
The if statements check if the RSI has crossed overbought or oversold levels and set the uph, dnh, upl, and dnl variables accordingly.
Finally, the plotcandle() function is used to plot the vertical lines on the chart. The open and close values are set to the src input, and the high and low values are set to the uph, dnh, upl, and dnl variables. The bordercolor argument is set to na to hide the borders of the lines, and the wickcolor argument is set to green or red, depending on whether the line is an overbought or oversold crossover.
/////////////////////////////////////////////////////////////////////////////////////////////////////////////////////////////////////////
The script hacks the plotcandle function to display just the wicks without the body. This hack simulates a vertical line. The body of the candle is non-existing since the open and close are the same and its color is set to null. The wicks are abutting resulting in a continuous vertical line.
Drawbacks include inability to set width and transparency of the lines. The plotcandle function does not allow setting the width and transparency of the wicks. This feature would be desirable.
The crossing of the RSI of overbought and undersold zones is used as an example in this published script. Any indicator can be used and this script can be executed on any other indicator by using "add indicator" on the desired indicator, and selecting the indicator as the source. I added crossover lines on the plotted RSI as an example.
//////////////////////////////////////////////////////Breakdown of the script////////////////////////////////////////////////////////
The src input determines which price data is used for the highest value calculation. By default, it is set to the close price.
The length input determines the length of the RSI calculation. By default, it is set to 14.
The mult input determines the multiplier of the highest value that is used to determine the height of the vertical lines. By default, it is set to 100%, meaning the lines will reach the highest value in the dataset.
The top and bot inputs determine the overbought and oversold levels for the RSI. By default, they are set to 70 and 30, respectively.
The current_rsi and previous_rsi variables calculate the RSI values for the current bar and the previous bar, respectively.
The hi_value variable finds the highest value in the dataset, and the hi variable calculates the height of the vertical lines based on the highest value and the user-defined multiplier. The lo variable calculates the distance between the highest value and the current price data.
The uph, dnh, upl, and dnl variables determine the height and low of the vertical lines for when the RSI crosses overbought or oversold levels.
The if statements check if the RSI has crossed overbought or oversold levels and set the uph, dnh, upl, and dnl variables accordingly.
Finally, the plotcandle() function is used to plot the vertical lines on the chart. The open and close values are set to the src input, and the high and low values are set to the uph, dnh, upl, and dnl variables. The bordercolor argument is set to na to hide the borders of the lines, and the wickcolor argument is set to green or red, depending on whether the line is an overbought or oversold crossover.
/////////////////////////////////////////////////////////////////////////////////////////////////////////////////////////////////////////
開源腳本
本著TradingView的真正精神,此腳本的創建者將其開源,以便交易者可以查看和驗證其功能。向作者致敬!雖然您可以免費使用它,但請記住,重新發佈程式碼必須遵守我們的網站規則。
免責聲明
這些資訊和出版物並不意味著也不構成TradingView提供或認可的金融、投資、交易或其他類型的意見或建議。請在使用條款閱讀更多資訊。
開源腳本
本著TradingView的真正精神,此腳本的創建者將其開源,以便交易者可以查看和驗證其功能。向作者致敬!雖然您可以免費使用它,但請記住,重新發佈程式碼必須遵守我們的網站規則。
免責聲明
這些資訊和出版物並不意味著也不構成TradingView提供或認可的金融、投資、交易或其他類型的意見或建議。請在使用條款閱讀更多資訊。