PINE LIBRARY
FunctionPolynomialRegression
Library "FunctionPolynomialRegression"
TODO:
polyreg(sample_x, sample_y) Method to return a polynomial regression channel using (X,Y) sample points.
Parameters:
sample_x: float array, sample data X points.
sample_y: float array, sample data Y points.
Returns: tuple with:
_predictions: Array with adjusted Y values.
_max_dev: Max deviation from the mean.
_min_dev: Min deviation from the mean.
_stdev/_sizeX: Average deviation from the mean.
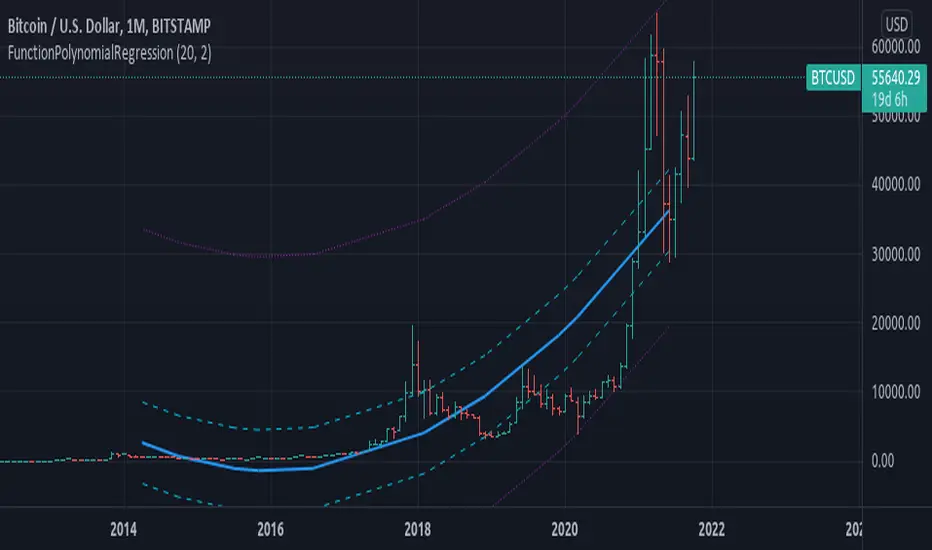
draw(sample_x, sample_y, extend, mid_color, mid_style, mid_width, std_color, std_style, std_width, max_color, max_style, max_width) Method for drawing the Polynomial Regression into chart.
Parameters:
sample_x: float array, sample point X value.
sample_y: float array, sample point Y value.
extend: string, default=extend.none, extend lines.
mid_color: color, default=color.blue, middle line color.
mid_style: string, default=line.style_solid, middle line style.
mid_width: int, default=2, middle line width.
std_color: color, default=color.aqua, standard deviation line color.
std_style: string, default=line.style_dashed, standard deviation line style.
std_width: int, default=1, standard deviation line width.
max_color: color, default=color.purple, max range line color.
max_style: string, default=line.style_dotted, max line style.
max_width: int, default=1, max line width.
Returns: line array.
TODO:
polyreg(sample_x, sample_y) Method to return a polynomial regression channel using (X,Y) sample points.
Parameters:
sample_x: float array, sample data X points.
sample_y: float array, sample data Y points.
Returns: tuple with:
_predictions: Array with adjusted Y values.
_max_dev: Max deviation from the mean.
_min_dev: Min deviation from the mean.
_stdev/_sizeX: Average deviation from the mean.
draw(sample_x, sample_y, extend, mid_color, mid_style, mid_width, std_color, std_style, std_width, max_color, max_style, max_width) Method for drawing the Polynomial Regression into chart.
Parameters:
sample_x: float array, sample point X value.
sample_y: float array, sample point Y value.
extend: string, default=extend.none, extend lines.
mid_color: color, default=color.blue, middle line color.
mid_style: string, default=line.style_solid, middle line style.
mid_width: int, default=2, middle line width.
std_color: color, default=color.aqua, standard deviation line color.
std_style: string, default=line.style_dashed, standard deviation line style.
std_width: int, default=1, standard deviation line width.
max_color: color, default=color.purple, max range line color.
max_style: string, default=line.style_dotted, max line style.
max_width: int, default=1, max line width.
Returns: line array.
Pine腳本庫
秉持TradingView一貫精神,作者已將此Pine代碼以開源函式庫形式發佈,方便我們社群中的其他Pine程式設計師重複使用。向作者致敬!您可以在私人專案或其他開源發表中使用此函式庫,但在公開發表中重用此代碼須遵守社群規範。
免責聲明
這些資訊和出版物並非旨在提供,也不構成TradingView提供或認可的任何形式的財務、投資、交易或其他類型的建議或推薦。請閱讀使用條款以了解更多資訊。
Pine腳本庫
秉持TradingView一貫精神,作者已將此Pine代碼以開源函式庫形式發佈,方便我們社群中的其他Pine程式設計師重複使用。向作者致敬!您可以在私人專案或其他開源發表中使用此函式庫,但在公開發表中重用此代碼須遵守社群規範。
免責聲明
這些資訊和出版物並非旨在提供,也不構成TradingView提供或認可的任何形式的財務、投資、交易或其他類型的建議或推薦。請閱讀使用條款以了解更多資訊。