PROTECTED SOURCE SCRIPT
已更新 Dividers Timeframe/Session/Calendar-Based [ARTech]
Dividers Timeframe/Session/Calendar-Based [ARTech]
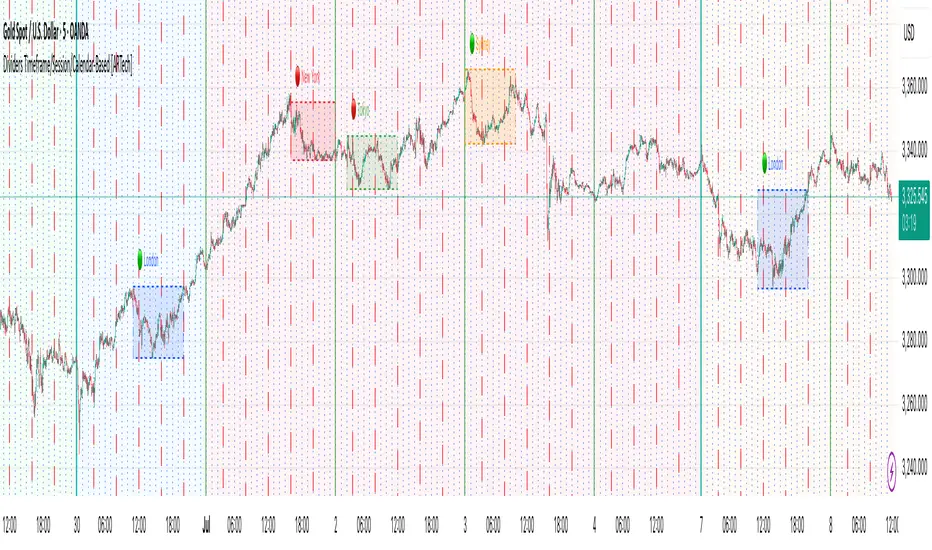
This indicator provides customizable visual dividers for multiple timeframes, trading sessions, and calendar-based periods (daily, weekly, monthly). It helps traders visually separate chart areas by key time boundaries without cluttering the chart with price lines.
Key Features:
Why use this indicator?
Divider Indicator helps keep your chart organized by visually segmenting timeframes, sessions, and calendar periods, aiding in better analysis of price action relative to important time boundaries.
How to Use
███████ Timezone ███████
Examples;
███████ Timeframe ███████
Use this section to display vertical divider lines at the opening of higher timeframe candles (e.g., 1H, 4H, Daily, Weekly). This helps visually separate price action according to larger market structures.
1. Enable a Timeframe:
Turn on one or more timeframes (e.g., 60, 240, D, W) by checking their respective toggle boxes.
2. Lines Mark Candle Opens:
Each active timeframe will draw a vertical line at the start of its candle, making it easier to align intraday moves with larger timeframe shifts.
3. Customize Line Style:
For each timeframe, you can individually set:
4. Use Multiple Timeframes Together:
You can enable multiple timeframe dividers simultaneously. To maintain clarity:
5. Visual Tip:
These dividers are especially useful for identifying higher timeframe candle opens during intraday trading, spotting breaks above/below previous candle ranges, or aligning session-based strategies with higher timeframe trends.
███████ Session ███████
Use this section to visually highlight specific trading sessions (e.g., London, New York, Tokyo, Sydney) on your chart using time zones, session ranges, and optional weekday filters. This helps focus your analysis on active market hours.
1. Enable a Session:
Activate up to 4 separate trading sessions. Each session can be named (e.g., "London") and customized independently.
2. Set Session Time and Days:
3. Session Box Drawing:
For each active session, the indicator will:
4. Session Labels and Directional Hints:
5. Display Options:
6. Visual Tip:
Session boxes are particularly useful for:
███████ Calendar-Based ███████
This section helps you visually segment your chart based on calendar periods: daily, weekly, and monthly. You can enable background color highlighting for individual days, weeks, or months to better track price movements within these time frames.
1. Enable Daily, Weekly, or Monthly Highlighting:
Toggle on the options for Daily, Weekly, and/or Monthly highlighting according to your needs.
2. Select Specific Days, Weeks, or Months:
3. Customize Colors for Each Period:
Assign distinct colors to each day, week, or month for easy differentiation. Choose hues that stand out but avoid colors that are too close in tone for adjacent periods.
4. Background Opacity:
Adjust the opacity level of the background coloring to ensure it complements your chart without obscuring price data.
5. Handling Partial Weeks and Overlaps:
The weekly highlighting accounts for months that span 4 to 6 weeks by allowing toggles up to 5 weeks, including weeks that may partially overlap with previous or next months.
6. Visual Tip:
Calendar-based backgrounds are excellent for:
This indicator provides customizable visual dividers for multiple timeframes, trading sessions, and calendar-based periods (daily, weekly, monthly). It helps traders visually separate chart areas by key time boundaries without cluttering the chart with price lines.
Key Features:
- Multi-Timeframe Dividers: Select up to 4 timeframes (e.g., 60 min, 4 hours, daily, weekly) to display customizable lines marking the start of each timeframe’s candle.
- Session Dividers: Define up to 4 trading sessions with user-defined time zones, colors, and active weekdays. The indicator highlights the session’s highest and lowest price range using a box, and compares the session’s opening and closing prices. Based on this comparison, it displays a green or red emoji to indicate bullish or bearish sessions, making it easy to identify session momentum visually.
- Calendar-Based Dividers: Enable daily, weekly, or monthly background color zones, with individual toggles and color settings for each day, week, or month. Perfect for visually distinguishing trading periods.
Why use this indicator?
Divider Indicator helps keep your chart organized by visually segmenting timeframes, sessions, and calendar periods, aiding in better analysis of price action relative to important time boundaries.
How to Use
███████ Timezone ███████
- A valid timezone name exactly as it appears in the chart’s lower-right corner (e.g. New York, London).
- A valid UTC offset in ±H:MM or ±HH:MM format. Hours: 0–14 (zero-padded or not, e.g. +1:30, +01:30, -0:00). Minutes: Must be 00, 15, 30, or 45.
Examples;
- UTC → ✅ Valid
- Exchange → ✅ Valid
- New York → ✅ Valid
- London → ✅ Valid
- Berlin → ✅ Valid
- America/New York → ❌ Invalid. (Use "New York" instead)
- +1:30 → ✅ Valid offset with single-digit hour
- +01:30 → ✅ Valid offset with zero-padded hour
- -05:00 → ✅ Valid negative offset
- -0:00 → ✅ Valid zero offset
- +1:1 → ❌ Invalid (minute must be 00, 15, 30, or 45)
- +2:50 → ❌ Invalid (minute must be 00, 15, 30, or 45)
- +15:00 → ❌ Invalid (hour must be 14 or below)
███████ Timeframe ███████
Use this section to display vertical divider lines at the opening of higher timeframe candles (e.g., 1H, 4H, Daily, Weekly). This helps visually separate price action according to larger market structures.
1. Enable a Timeframe:
Turn on one or more timeframes (e.g., 60, 240, D, W) by checking their respective toggle boxes.
2. Lines Mark Candle Opens:
Each active timeframe will draw a vertical line at the start of its candle, making it easier to align intraday moves with larger timeframe shifts.
3. Customize Line Style:
For each timeframe, you can individually set:
- Line Style: Solid, dashed, or dotted.
- Line Width: From 1 to 10 pixels.
- Line Color: Pick any color to match your chart theme.
- Opacity: Use transparent colors to avoid overwhelming the chart.
4. Use Multiple Timeframes Together:
You can enable multiple timeframe dividers simultaneously. To maintain clarity:
- Use distinct colors for each timeframe.
- Use thinner or dotted lines for lower timeframes and bolder lines for higher ones.
- Match line style and color intensity to reflect timeframe importance. (e.g., a thick green solid line for Weekly, a thin gray dotted line for 1H)
5. Visual Tip:
These dividers are especially useful for identifying higher timeframe candle opens during intraday trading, spotting breaks above/below previous candle ranges, or aligning session-based strategies with higher timeframe trends.
███████ Session ███████
Use this section to visually highlight specific trading sessions (e.g., London, New York, Tokyo, Sydney) on your chart using time zones, session ranges, and optional weekday filters. This helps focus your analysis on active market hours.
1. Enable a Session:
Activate up to 4 separate trading sessions. Each session can be named (e.g., "London") and customized independently.
2. Set Session Time and Days:
- Define session time using the hhmm-hhmm format. (e.g., 0800-1700)
- Select which days of the week the session applies to (Sunday through Saturday)
- Set your preferred time zone (UTC, Exchange, etc.) from the global settings.
3. Session Box Drawing:
For each active session, the indicator will:
- Draw a background-colored box from the session’s start to end time.
- Stretch the box to fit the highest and lowest price within that time window.
- Draw an outline using customizable border style and width.
4. Session Labels and Directional Hints:
- Optionally display the session’s name as a label.
- The indicator compares the session’s opening and closing prices. Based on the result:
📈 Green emoji shows a bullish session (close >= open)
📉 Red emoji shows a bearish session (close < open)
5. Display Options:
- Show all sessions, only the last session, or a specific number of previous sessions.
- Customize label size, location (top/bottom), and whether it appears inside or outside the box.
- Adjust background opacity to blend the sessions neatly into your chart.
6. Visual Tip:
Session boxes are particularly useful for:
- Spotting repeated highs/lows during active trading hours.
- Recognizing session-based breakouts or consolidations.
- Comparing performance across different markets and time zones.
███████ Calendar-Based ███████
This section helps you visually segment your chart based on calendar periods: daily, weekly, and monthly. You can enable background color highlighting for individual days, weeks, or months to better track price movements within these time frames.
1. Enable Daily, Weekly, or Monthly Highlighting:
Toggle on the options for Daily, Weekly, and/or Monthly highlighting according to your needs.
2. Select Specific Days, Weeks, or Months:
- For Daily, enable any combination of days (up to 7) to color-code.
- For Weekly, enable up to 5 weeks per month to cover partial weeks.
- For Monthly, enable up to 12 months with individual toggles and colors.
3. Customize Colors for Each Period:
Assign distinct colors to each day, week, or month for easy differentiation. Choose hues that stand out but avoid colors that are too close in tone for adjacent periods.
4. Background Opacity:
Adjust the opacity level of the background coloring to ensure it complements your chart without obscuring price data.
5. Handling Partial Weeks and Overlaps:
The weekly highlighting accounts for months that span 4 to 6 weeks by allowing toggles up to 5 weeks, including weeks that may partially overlap with previous or next months.
6. Visual Tip:
Calendar-based backgrounds are excellent for:
- Quickly identifying price behavior within specific calendar units.
- Comparing price action across days, weeks, or months.
- Spotting seasonal trends or recurring patterns tied to calendar cycles.
發行說明
Fixed a bug where disabling all weekdays in the Session settings would unintentionally activate all days. Now, when all weekdays are turned off, the session will remain inactive as expected.發行說明
-發行說明
-受保護腳本
此腳本以閉源形式發佈。 不過,您可以自由使用,沒有任何限制 — 點擊此處了解更多。
I develop custom Pine Script indicators and share educational content.
If you enjoy my works, you can support me on “Buy Me a Coffee” ☕
👉 buymeacoffee.com/arrowoftime
If you enjoy my works, you can support me on “Buy Me a Coffee” ☕
👉 buymeacoffee.com/arrowoftime
免責聲明
這些資訊和出版物並非旨在提供,也不構成TradingView提供或認可的任何形式的財務、投資、交易或其他類型的建議或推薦。請閱讀使用條款以了解更多資訊。
受保護腳本
此腳本以閉源形式發佈。 不過,您可以自由使用,沒有任何限制 — 點擊此處了解更多。
I develop custom Pine Script indicators and share educational content.
If you enjoy my works, you can support me on “Buy Me a Coffee” ☕
👉 buymeacoffee.com/arrowoftime
If you enjoy my works, you can support me on “Buy Me a Coffee” ☕
👉 buymeacoffee.com/arrowoftime
免責聲明
這些資訊和出版物並非旨在提供,也不構成TradingView提供或認可的任何形式的財務、投資、交易或其他類型的建議或推薦。請閱讀使用條款以了解更多資訊。