PROTECTED SOURCE SCRIPT
已更新 Mykung's Financial Table (Revenue, EPS, Net margin)
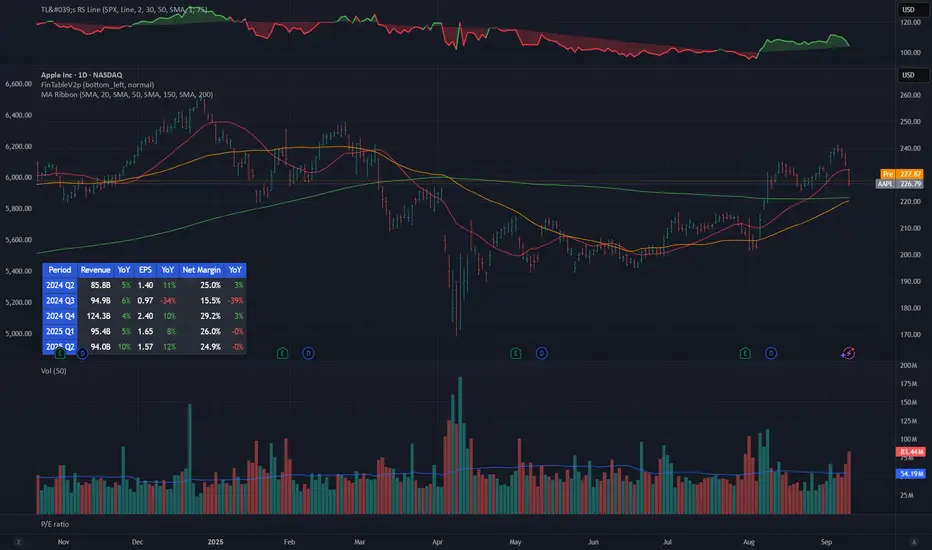
A compact fundamentals dashboard that displays the last **8 fiscal quarters** for the current symbol. It’s designed for clarity (minimal decimals) and flexible presentation, with a dynamic column layout and accurate quarter labels.
## What it shows
**Columns (left → right):**
`Quarter | Revenue | YoY % | QoQ % | EPS | YoY % | QoQ % | [Net Margin | YoY % | QoQ %]`
* **Quarter** — formatted as `YYYY Q#` (e.g., `2025 Q2`).
Labels are derived from **fiscal period end dates** for accuracy.
* **Revenue** — compact notation (K/M/B/T), **no decimals**.
* **EPS** — uses **Diluted EPS** by default and falls back to **Basic EPS** if Diluted is unavailable. Displayed with **2 decimals**.
* **Net Margin** — displayed with **1 decimal**.
*Note:* Its YoY/QoQ columns represent **percentage-point** changes (absolute differences), not relative percent changes.
* **YoY % and QoQ %** — shown as **integers** (no decimals). Positive values are colored green; negative values red.
## Key features
* **Accurate quarter labels** from fundamentals (`FISCAL_PERIOD_END_DATE` → fallback `FINANCIAL_END_TIME`).
* **Dynamic layout:**
* Show all 10 columns (include Net Margin group), or
* Hide Net Margin to render a **7-column** table automatically.
* **Row order:** **Oldest at top → Latest at bottom** (chronological reading).
* **Customization:**
* Table position (nine presets: corners/centers).
* Text size.
* Table background color.
* **Header colors** (text & background) — also applied to the **Quarter** column cells for visual grouping.
* **Body text color** for data cells.
## Inputs (Settings)
* **Table Position** — place the table anywhere on the chart.
* **Text Size** — auto/tiny/small/normal/large/huge.
* **Table Background** — overall table BG color.
* **Header Background Color** — header & Quarter column background.
* **Header Text Color** — header & Quarter column text color.
* **Body Text Color** — data cells text color.
* **Show Net Margin Group (Cols 7–9)** — toggle between 10-col or 7-col layout.
## Calculations
* **QoQ %** = $(Current − Previous) / |Previous|$ × 100
* **YoY %** = $(Current − 4Q Ago) / |4Q Ago|$ × 100
* **Net Margin YoY / QoQ** = **difference in percentage points** (e.g., 12.4% → 10.9% = −1.5pp)
## Notes & limitations
* Requires symbols with **quarterly fundamentals** on TradingView. If a field is unavailable, it shows **N/A**.
* Fundamentals are updated by TradingView; values may refresh after earnings filings.
* Works on any chart timeframe; data comes from **fundamentals**, not price bars.
* Colors are indicative only and not investment advice.
**Built for readability**: minimal decimals (EPS 2dp, Net Margin 1dp), integer percentages, and compact revenue formatting—so you can scan eight quarters at a glance.
發行說明
Change from percentage-point (pp) to % (relative change) for Net margin YoY% and QoQ%發行說明
fixed many bugs發行說明
fixed some values發行說明
A simplified and lightweight financial table designed for quick stock analysis.- Shows 5 most recent reporting periods with Revenue, EPS, and optional Net Margin
- Displays only YoY (%) growth (no QoQ for cleaner view)
- Column headers are simplified (“Period”, “YoY”)
- Flexible table layout: choose 7 or 10 columns depending on Net Margin visibility
- Minimalist number formatting for a clear, modern look
- Missing data points are displayed as “-”
- Fully customizable header colors, background, and text colors
This public version is lighter and faster, making it ideal for traders and analysts who want essential quarterly metrics at a glance.
發行說明
Fixed the digit of revenue發行說明
Fixed some bugs受保護腳本
此腳本以閉源形式發佈。 不過,您可以自由使用,沒有任何限制 — 點擊此處了解更多。
免責聲明
這些資訊和出版物並非旨在提供,也不構成TradingView提供或認可的任何形式的財務、投資、交易或其他類型的建議或推薦。請閱讀使用條款以了解更多資訊。
免責聲明
這些資訊和出版物並非旨在提供,也不構成TradingView提供或認可的任何形式的財務、投資、交易或其他類型的建議或推薦。請閱讀使用條款以了解更多資訊。