OPEN-SOURCE SCRIPT
[LAVA] UNO Overlay
EDIT: Ignore the comments... I can't get the update to show due to hard brackets "[ ]" being censored for some reason.... but they show up in here so this is where the updates will show.
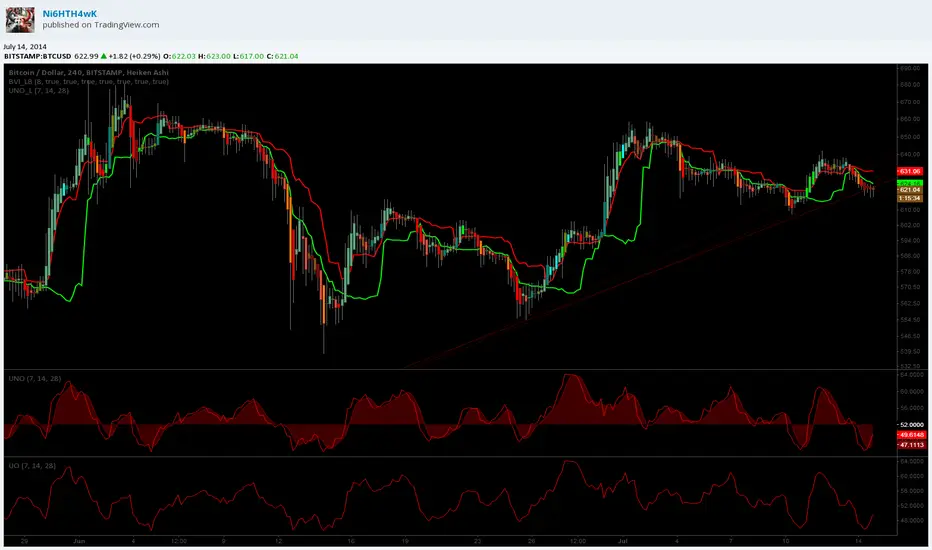
This is the Ultimate (Nonlinear) Oscillator in overlay format. Took me a while to figure out the best configuration and finally found this one. From what I've observed, this is basically a support/resistance line indicator. When the candle moves thru the supporting/resisting line, its a entry/exit point or an indicator that the opposite side should be targeted depending on the market condition. Ignore the wicks as they go thru the line constantly.
Go here to see updates...
pastebin.com/vziz8rzd
開源腳本
本著TradingView的真正精神,此腳本的創建者將其開源,以便交易者可以查看和驗證其功能。向作者致敬!雖然您可以免費使用它,但請記住,重新發佈程式碼必須遵守我們的網站規則。
免責聲明
這些資訊和出版物並不意味著也不構成TradingView提供或認可的金融、投資、交易或其他類型的意見或建議。請在使用條款閱讀更多資訊。
開源腳本
本著TradingView的真正精神,此腳本的創建者將其開源,以便交易者可以查看和驗證其功能。向作者致敬!雖然您可以免費使用它,但請記住,重新發佈程式碼必須遵守我們的網站規則。
免責聲明
這些資訊和出版物並不意味著也不構成TradingView提供或認可的金融、投資、交易或其他類型的意見或建議。請在使用條款閱讀更多資訊。