INVITE-ONLY SCRIPT
已更新 FibAlgo® - Oscillator Matrix™
FibAlgo® - Oscillator Matrix™
OVERVIEW
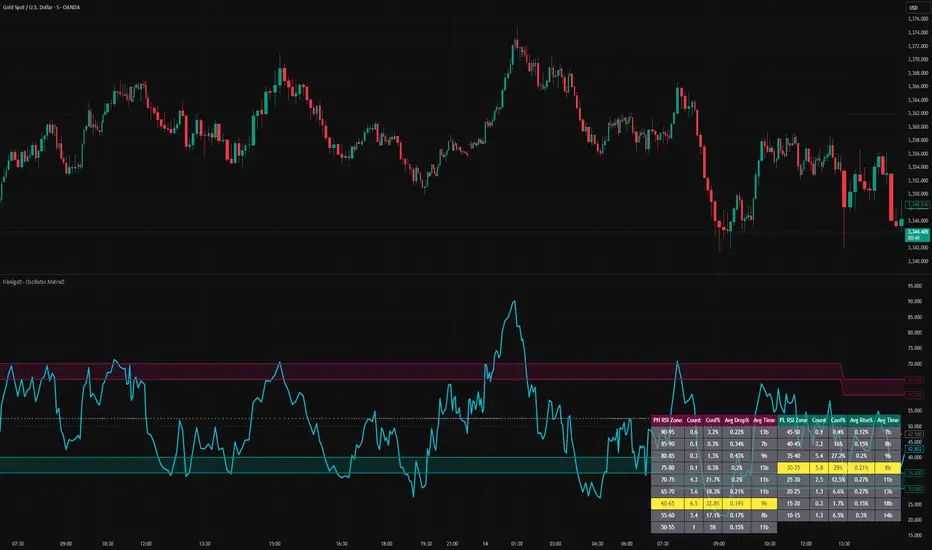
This script takes traditional oscillator analysis a step further by providing a dynamic oscillator framework based on statistical data. Instead of using fixed overbought and oversold levels like 70/30, it analyzes historical price peaks (PH) and troughs (PL) to determine which oscillator levels have historically led to the most frequent reversals. Based on this analysis, it creates "smart" and dynamic overbought (resistance) and oversold (support) zones that continuously update according to market conditions. This offers a data-driven approach that adapts to the market's current volatility and character, unlike the static nature of standard oscillators.

CONCEPTS
The power of the FibAlgo® - Oscillator Matrix™ comes from four core concepts. Understanding this logic will allow you to use the indicator most effectively.
1. The Statistical Engine (ZigZag and Pivot Analysis): The indicator's brain uses a ZigZag algorithm to detect significant turning points (peaks and troughs) in price action. It analyzes a user-defined number of past peaks (PH) and troughs (PL) as set by Lookback Pivots. Each time a pivot point is formed, it records the oscillator's value at that moment (e.g., RSI, MFI, Stochastic, etc.).
2. Frequency Analysis and Dynamic Zones:
These recorded oscillator values are grouped into categories with specific ranges (e.g., '80-85', '85-90'). The indicator then statistically calculates which category has occurred most frequently at price peaks and which at price troughs.
Maroon Band (Peak Zone): This is the dynamic overbought/resistance zone, representing the oscillator range where price peaks have historically occurred most often.
Teal Band (Trough Zone): This is the dynamic oversold/support zone, representing the oscillator range where price troughs have historically occurred most often.
3. Data Decay (Adaptive Analysis):
When this advanced feature is enabled, the indicator gives more statistical weight to the most recent pivots in its analysis. This is based on the principle that "recent market behavior is more relevant than older data," allowing the indicator to adapt more quickly to changing market conditions. You can control the weighting of recent data with the
Decay Rate setting.
4. Built-in Performance Analysis: The indicator doesn't just show potential reversal zones; it also measures the historical performance of these zones. For each oscillator zone, it calculates the average percentage the price rose or fell (
Avg Drop% / Avg Rise%) and the average number of bars it took for that maximum move to occur (Avg Time). This feature provides critical data for assessing the strength and potential of signals.

FEATURES
Multi-Oscillator Support: Don't limit yourself to a single oscillator. Switch between popular oscillators like RSI, MFI, Momentum, Stochastic, Stochastic RSI, and Chaikin Money Flow to diversify your analysis.
Dynamic and Adaptive Zones: Statistically significant overbought (Maroon) and oversold (Teal) zones that update themselves as new market data comes in.
Advanced Analysis Table: A powerful dashboard that summarizes all of the indicator's statistical findings. This table presents the following data for each oscillator zone:
Zone: The oscillator value range.
Count: The weighted number of pivots that occurred in that zone.
Conf% (Confidence): The percentage telling you how often pivots occurred in this zone relative to all others.
Avg Drop% / Avg Rise%: Shows the average percentage price moved after a pivot in that zone.
Avg Time: Shows the average number of bars it took for the maximum price move to occur.
Built-in Performance Tracking: Objectively measure the historical effectiveness of signal zones to see which levels have offered higher probability trades.
Comprehensive Customization: Adjust numerous parameters to fit your personal strategy, including the ZigZag period, the number of pivots to analyze, the data decay rate, and each oscillator's specific settings (length, smoothing, etc.).


USAGE
The primary purpose of this indicator is to identify buying and selling opportunities based on data-driven zones.
SELL Signals:
Wait for the oscillator to enter the Maroon Band (Peak Zone). This indicates that the oscillator has reached a level historically associated with price tops.
Confirm the signal by checking the Analysis Table. A high
Conf% (Confidence percentage) and a significant Avg Drop% for the corresponding zone suggest a higher probability trade.

BUY Signals:
Wait for the oscillator to enter the Teal Band (Trough Zone). This indicates that the oscillator has reached a level historically associated with price bottoms.
Confirm the signal by checking the Analysis Table. Look for a high Conf% and a strong Avg Rise%. This confirms that the zone has historically provided profitable buying opportunities.

Important Note: While this indicator is a powerful decision-support tool, it should always be used in conjunction with your own price action analysis and risk management strategies. The
Avg Time column can give you an idea of how long a trade might potentially take to play out.
OVERVIEW
This script takes traditional oscillator analysis a step further by providing a dynamic oscillator framework based on statistical data. Instead of using fixed overbought and oversold levels like 70/30, it analyzes historical price peaks (PH) and troughs (PL) to determine which oscillator levels have historically led to the most frequent reversals. Based on this analysis, it creates "smart" and dynamic overbought (resistance) and oversold (support) zones that continuously update according to market conditions. This offers a data-driven approach that adapts to the market's current volatility and character, unlike the static nature of standard oscillators.
CONCEPTS
The power of the FibAlgo® - Oscillator Matrix™ comes from four core concepts. Understanding this logic will allow you to use the indicator most effectively.
1. The Statistical Engine (ZigZag and Pivot Analysis): The indicator's brain uses a ZigZag algorithm to detect significant turning points (peaks and troughs) in price action. It analyzes a user-defined number of past peaks (PH) and troughs (PL) as set by Lookback Pivots. Each time a pivot point is formed, it records the oscillator's value at that moment (e.g., RSI, MFI, Stochastic, etc.).
2. Frequency Analysis and Dynamic Zones:
These recorded oscillator values are grouped into categories with specific ranges (e.g., '80-85', '85-90'). The indicator then statistically calculates which category has occurred most frequently at price peaks and which at price troughs.
Maroon Band (Peak Zone): This is the dynamic overbought/resistance zone, representing the oscillator range where price peaks have historically occurred most often.
Teal Band (Trough Zone): This is the dynamic oversold/support zone, representing the oscillator range where price troughs have historically occurred most often.
3. Data Decay (Adaptive Analysis):
When this advanced feature is enabled, the indicator gives more statistical weight to the most recent pivots in its analysis. This is based on the principle that "recent market behavior is more relevant than older data," allowing the indicator to adapt more quickly to changing market conditions. You can control the weighting of recent data with the
Decay Rate setting.
4. Built-in Performance Analysis: The indicator doesn't just show potential reversal zones; it also measures the historical performance of these zones. For each oscillator zone, it calculates the average percentage the price rose or fell (
Avg Drop% / Avg Rise%) and the average number of bars it took for that maximum move to occur (Avg Time). This feature provides critical data for assessing the strength and potential of signals.
FEATURES
Multi-Oscillator Support: Don't limit yourself to a single oscillator. Switch between popular oscillators like RSI, MFI, Momentum, Stochastic, Stochastic RSI, and Chaikin Money Flow to diversify your analysis.
Dynamic and Adaptive Zones: Statistically significant overbought (Maroon) and oversold (Teal) zones that update themselves as new market data comes in.
Advanced Analysis Table: A powerful dashboard that summarizes all of the indicator's statistical findings. This table presents the following data for each oscillator zone:
Zone: The oscillator value range.
Count: The weighted number of pivots that occurred in that zone.
Conf% (Confidence): The percentage telling you how often pivots occurred in this zone relative to all others.
Avg Drop% / Avg Rise%: Shows the average percentage price moved after a pivot in that zone.
Avg Time: Shows the average number of bars it took for the maximum price move to occur.
Built-in Performance Tracking: Objectively measure the historical effectiveness of signal zones to see which levels have offered higher probability trades.
Comprehensive Customization: Adjust numerous parameters to fit your personal strategy, including the ZigZag period, the number of pivots to analyze, the data decay rate, and each oscillator's specific settings (length, smoothing, etc.).
USAGE
The primary purpose of this indicator is to identify buying and selling opportunities based on data-driven zones.
SELL Signals:
Wait for the oscillator to enter the Maroon Band (Peak Zone). This indicates that the oscillator has reached a level historically associated with price tops.
Confirm the signal by checking the Analysis Table. A high
Conf% (Confidence percentage) and a significant Avg Drop% for the corresponding zone suggest a higher probability trade.
BUY Signals:
Wait for the oscillator to enter the Teal Band (Trough Zone). This indicates that the oscillator has reached a level historically associated with price bottoms.
Confirm the signal by checking the Analysis Table. Look for a high Conf% and a strong Avg Rise%. This confirms that the zone has historically provided profitable buying opportunities.
Important Note: While this indicator is a powerful decision-support tool, it should always be used in conjunction with your own price action analysis and risk management strategies. The
Avg Time column can give you an idea of how long a trade might potentially take to play out.
發行說明
FibAlgo® Oscillator Matrix™ Update: A More Intuitive and Powerful Experience!Hello FibAlgo® Family,
We're excited to announce that we've enhanced our Oscillator Matrix™ indicator based on your feedback! This update includes a series of improvements designed to make the indicator easier to use, boost its performance, and provide clearer analysis.
Here’s what’s new for you:
1. A More Organized and Intuitive Settings Menu
We've reorganized the indicator settings. All related core settings are now grouped under the
"Algorithm Settings" tab. This makes it easier and faster for you to find and configure the essential features that power the indicator's "brain" all in one place.
2. A Cleaner Workspace and Enhanced Performance
You can now show or hide the statistical
"Analysis Table" with a single click. When you don't need the table, you can declutter your chart space, which also allows the indicator to run even faster, reducing the load on your computer.
3. Increased Consistency and Reliability
To ensure the indicator's statistical engine always operates with maximum stability and reliability, we have standardized the analysis source to the closing price. This small but important change helps ensure the Oscillator Matrix™ produces consistent and predictable results across different market conditions.
4. A Cleaner Start
The User Guide will now be hidden by default when you first add the indicator to your chart. This gives you a clean slate right from the start. You can easily re-enable it from the settings whenever you need it.
We believe these improvements will make your experience with the FibAlgo® Oscillator Matrix™ more enjoyable and efficient.
Happy trading!
僅限邀請腳本
只有經作者批准的使用者才能訪問此腳本。您需要申請並獲得使用權限。該權限通常在付款後授予。如欲了解更多詳情,請依照以下作者的說明操作,或直接聯絡FibAlgo。
除非您完全信任其作者並了解腳本的工作原理,否則TradingView不建議您付費或使用腳本。您也可以在我們的社群腳本中找到免費的開源替代方案。
作者的說明
🚨Get premium: FibAlgo.com
❓Do you have feedback or indicator ideas? Feel free to email us for feedback -> support@fibalgo.com
提醒:在請求訪問權限之前,請閱讀僅限邀請腳本指南。
免責聲明
這些資訊和出版物並不意味著也不構成TradingView提供或認可的金融、投資、交易或其他類型的意見或建議。請在使用條款閱讀更多資訊。