OPEN-SOURCE SCRIPT
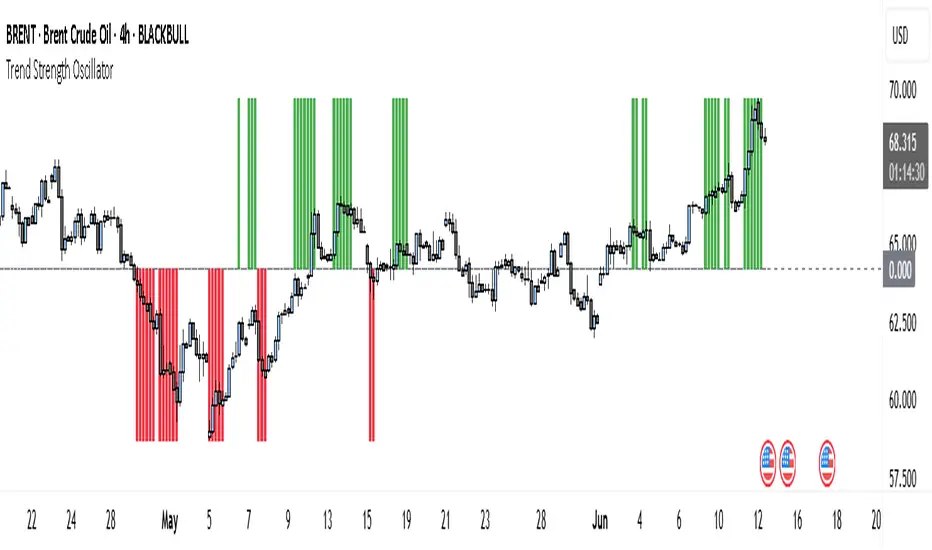
Trend Strength Oscillator
📌 What Is the Trend Strength Oscillator?
The Trend Strength Oscillator is a visual tool that helps traders understand the overall direction and strength of the market trend. Instead of using multiple indicators separately, this tool combines three trusted methods into one clear, color-coded bar chart. The bars change based on whether the market is strongly trending up, down, or just moving sideways.
Imagine it as a traffic light for trading:
• Green means it’s safe to consider buying (strong uptrend).
• Red means consider selling or avoiding longs (strong downtrend).
• Gray means wait, the market isn’t clearly trending.
🧠 How It Works — The 3 Main Components
1. EMA Slope
The EMA (Exponential Moving Average) tracks the average price but reacts more quickly to changes. If the EMA is rising, it means the market is likely moving upward. If it’s falling, the trend is likely downward.
2. RSI Direction
RSI (Relative Strength Index) measures momentum. This tool compares the RSI to its smoothed average. If the RSI is above its average, momentum is up. If it’s below, momentum is down.
3. ADX Strength
ADX (Average Directional Index) measures how strong a trend is, not the direction. So even if EMA and RSI agree on a trend, the ADX must confirm it’s strong enough to be worth trading.
Only when all three indicators agree do we consider it a strong trend.
🧮 What the Oscillator Shows
The result of combining those components is a number that becomes a colored bar:
• +2 means all three signals are bullish → green bar.
• -2 means all three signals are bearish → red bar.
• Anything else (e.g., mixed signals or weak ADX) → gray bar.
This makes the chart super easy to read at a glance, even for beginners.
📈 How to Use It in Trading
You can use the Trend Strength Oscillator in a few simple ways:
• Entering Trades:
Look for a green bar when you want to buy or go long. Look for a red bar when you want to sell or go short. These bars mean all systems are “go” in the same direction.
• Avoiding Mistakes:
If the bar is gray, it’s a warning that the market is undecided or weak. It’s often better to wait for a clearer signal rather than force a trade.
• Managing Existing Trades:
If you’re in a trade and the bar color shifts back to gray, that can be a clue that the trend is losing strength. You might tighten your stop-loss or take some profit.
🧭 Final Thoughts
This indicator doesn’t give you a trade entry every few minutes. Instead, it helps you stay on the right side of strong moves and avoid choppy or sideways markets. It’s especially helpful for:
• Trend-following traders
• People who want clean, simple visuals
• Beginners who get overwhelmed with too many indicators
Let me know if you'd like to see this paired with another tool like volume or MACD, or if you’d like a chart screenshot to visualize how this looks live.
開源腳本
秉持TradingView一貫精神,這個腳本的創作者將其設為開源,以便交易者檢視並驗證其功能。向作者致敬!您可以免費使用此腳本,但請注意,重新發佈代碼需遵守我們的社群規範。
Trade forex, indices, stocks and metals with up to US$100.000 in company's funding.
Complete a challenge to access funding or go for instant deposit.
Trading involves substantial risk. Not financial advice
Complete a challenge to access funding or go for instant deposit.
Trading involves substantial risk. Not financial advice
免責聲明
這些資訊和出版物並非旨在提供,也不構成TradingView提供或認可的任何形式的財務、投資、交易或其他類型的建議或推薦。請閱讀使用條款以了解更多資訊。