thyago.weber

EMA 10 21 Crossover

9
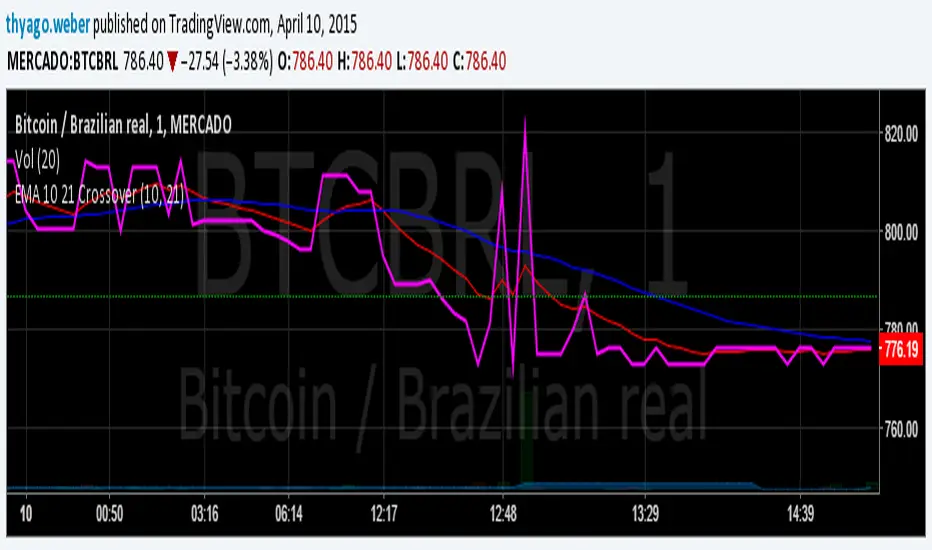
Study created using this bicointalk.org tread:

bitcointalk.org/index.php?topic=6050...
開源腳本

本著真正的TradingView精神,該腳本的作者將其開源發布,以便交易者可以理解和驗證它。為作者喝彩吧!您可以免費使用它,但在出版物中重複使用此代碼受網站規則的約束。 您可以收藏它以在圖表上使用。

免責聲明

這些資訊和出版物並不意味著也不構成TradingView提供或認可的金融、投資、交易或其他類型的意見或建議。請在使用條款閱讀更多資訊。

想在圖表上使用此腳本?
////////////////////////////////////////////////////////////
//  Copyright by HPotter v1.0 20/06/2014
// The Moving Average Crossover trading strategy is possibly the most popular
// trading strategy in the world of trading. First of them were written in the
// middle of XX century, when commodities trading strategies became popular.
// This strategy is a good example of so-called traditional strategies. 
// Traditional strategies are always long or short. That means they are never 
// out of the market. The concept of having a strategy that is always long or 
// short may be scary, particularly in today’s market where you don’t know what 
// is going to happen as far as risk on any one market. But a lot of traders 
// believe that the concept is still valid, especially for those of traders who 
// do their own research or their own discretionary trading. 
// This version uses crossover of moving average and its exponential moving average. 
////////////////////////////////////////////////////////////
study(title="EMA 10 21 Crossover", shorttitle="EMA 10 21 Crossover", overlay = true)
LengthEMA10 = input(10,minval=1)
LengthEMA21 = input(21,minval=1)

xEMA10 = ema(close, LengthEMA10)
xEMA21 = ema(xEMA10, LengthEMA21)

pos = iff(xEMA21 < xEMA10 , 1,
	    iff(xEMA21 > xEMA10, -1, nz(pos[1], 0))) 
barcolor(pos == -1 ? red: pos == 1 ? green : blue)
plot(xEMA10, color=red, title="xEMA10")
plot(xEMA21, color=blue, title="xEMA21")