INVITE-ONLY SCRIPT
已更新 Price Action and market structure [Tcs] | PA
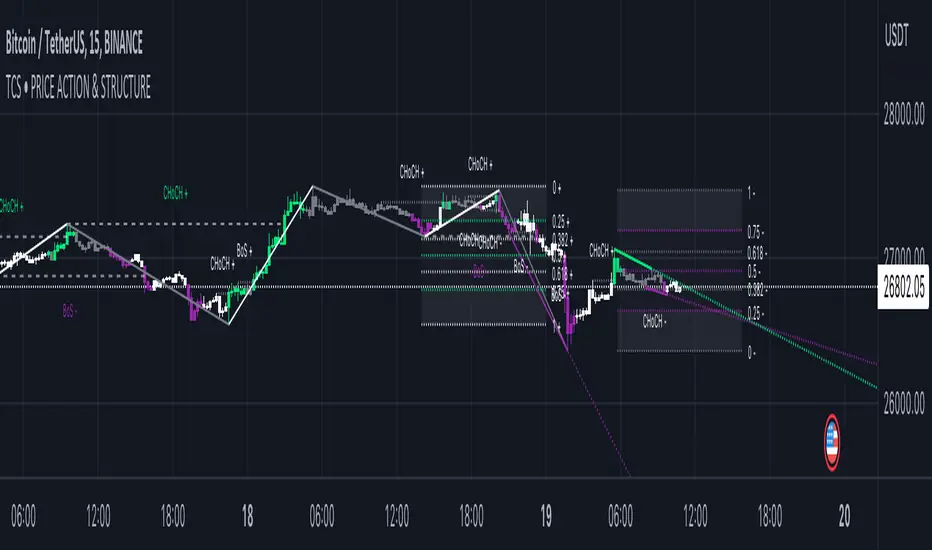
This indicator shows in real time the clearest and most complete vision of the price market structure, without considering volumes.
It has been developed mainly to identify price retracements in order to find the best entries in the market, but it include also other features which can be helpful for traders.
The indicator detects and highlight on the chart the market movement in multiple ways, including swing high, swing lows, the break of structure (BoS), change of character (CoCh), possible retracement movement, trend-lines generated through pivots, fibonacci and quarters theory levels based on previous pivot and daily, weekly and monthly highs and lows.
It can be set up on two different pivots look-back, one faster and one slower, to simplify the development of strategies for traders.
A longer look-back can detect a "slower" and less noisy structure, which can be more useful to detect massive retracements, while a shorter look-back can be useful to detect faster market moves, perfect for scalpers and to develop small price movement strategies.
Indicator features:
- Trend detection highlighted with colors - candles are colored in four different colors, and it's possible to choose if detect the fast and slow trend:
• Bullish move after structure break – green
• Bullish retracements – gray
• Bearish move after structure break – purple
• Bearish retracements – white

In this way traders can have a realtime vision of when the market is retracing in order to find better entries than entry immediately on a break of structure. It can be integrated with order blocks, ema or others indicators which can be helpful as support or resistance.
- Pivots and structure labels - in order to identify immediately if the trend is bullish, bearish or is changing direction:
• BoS + and BoS - are the bullish and bearish break of structure, respectively, and are colored to indicate a slower look-back, in gray to indicate a faster pivot look-back
• CoCh + and CoCh - are the bullish and bearish change of characters, respectively, and are colored to indicate a slower look-back.
• HH, HL, LL, and LH indicate the pivots of the trend. Al the pivots appear just when the pivots, based on fast or slow pivot look-back are confirmed

- Zigzag - The zigzag line helps to remove market noise and read the market structure in a simpler way.
• It's possible to select the zigzag line based on the slow or fast trend.
• Fast pivot look-back

•Slow pivot look-back

- Quarters theory and Fibonacci retracement:
• It creates a retracement that can be based on the fast or slow trend and small or big market move.
• The retracement is both bullish and bearish and includes the major Fibonacci levels and the most valuable areas from the quarters theory of market retracement.
• This helps to detect good entry points.

- Support and resistance, Daily, weekly, and monthly high, lows - just to heave a more clear view of important levels:
• It plots the highest and lowest pivot points based on the selected look-back.
• It plots the highs and lows of the day, week, and month.

- Trendlines:
• It plots the trend-lines based on past pivots.
• Here as well, it is possible to choose between fast and slow trend pivot look-back.

It's important to highlight that the indicator remarks on all facets of pure price action, not the smart money concept or liquidity areas.
Please note that this indicator is for educational purposes only and should not be used for trading without further testing and analysis.
It has been developed mainly to identify price retracements in order to find the best entries in the market, but it include also other features which can be helpful for traders.
The indicator detects and highlight on the chart the market movement in multiple ways, including swing high, swing lows, the break of structure (BoS), change of character (CoCh), possible retracement movement, trend-lines generated through pivots, fibonacci and quarters theory levels based on previous pivot and daily, weekly and monthly highs and lows.
It can be set up on two different pivots look-back, one faster and one slower, to simplify the development of strategies for traders.
A longer look-back can detect a "slower" and less noisy structure, which can be more useful to detect massive retracements, while a shorter look-back can be useful to detect faster market moves, perfect for scalpers and to develop small price movement strategies.
Indicator features:
- Trend detection highlighted with colors - candles are colored in four different colors, and it's possible to choose if detect the fast and slow trend:
• Bullish move after structure break – green
• Bullish retracements – gray
• Bearish move after structure break – purple
• Bearish retracements – white
In this way traders can have a realtime vision of when the market is retracing in order to find better entries than entry immediately on a break of structure. It can be integrated with order blocks, ema or others indicators which can be helpful as support or resistance.
- Pivots and structure labels - in order to identify immediately if the trend is bullish, bearish or is changing direction:
• BoS + and BoS - are the bullish and bearish break of structure, respectively, and are colored to indicate a slower look-back, in gray to indicate a faster pivot look-back
• CoCh + and CoCh - are the bullish and bearish change of characters, respectively, and are colored to indicate a slower look-back.
• HH, HL, LL, and LH indicate the pivots of the trend. Al the pivots appear just when the pivots, based on fast or slow pivot look-back are confirmed
- Zigzag - The zigzag line helps to remove market noise and read the market structure in a simpler way.
• It's possible to select the zigzag line based on the slow or fast trend.
• Fast pivot look-back
•Slow pivot look-back
- Quarters theory and Fibonacci retracement:
• It creates a retracement that can be based on the fast or slow trend and small or big market move.
• The retracement is both bullish and bearish and includes the major Fibonacci levels and the most valuable areas from the quarters theory of market retracement.
• This helps to detect good entry points.
- Support and resistance, Daily, weekly, and monthly high, lows - just to heave a more clear view of important levels:
• It plots the highest and lowest pivot points based on the selected look-back.
• It plots the highs and lows of the day, week, and month.
- Trendlines:
• It plots the trend-lines based on past pivots.
• Here as well, it is possible to choose between fast and slow trend pivot look-back.
It's important to highlight that the indicator remarks on all facets of pure price action, not the smart money concept or liquidity areas.
Please note that this indicator is for educational purposes only and should not be used for trading without further testing and analysis.
發行說明
• Fixed some bugs on candle colors settings• Added alert conditions on structure breaks both for "fast structure" and "slow structure"
僅限邀請腳本
僅作者批准的使用者才能訪問此腳本。您需要申請並獲得使用許可,通常需在付款後才能取得。更多詳情,請依照作者以下的指示操作,或直接聯絡zendrer。
TradingView不建議在未完全信任作者並了解其運作方式的情況下購買或使用腳本。您也可以在我們的社群腳本中找到免費的開源替代方案。
作者的說明
You can find all the necessary info in the website http://www.thecryptostrategist.com
For the access to premium indicators please contact me on tradingview
免責聲明
這些資訊和出版物並非旨在提供,也不構成TradingView提供或認可的任何形式的財務、投資、交易或其他類型的建議或推薦。請閱讀使用條款以了解更多資訊。