OPEN-SOURCE SCRIPT
Concretum Bands
Definition
The Concretum Bands indicator recreates the Upper and Lower Bound of the Noise Area described in the paper "Beat the Market: An Effective Intraday Momentum Strategy for S&P500 ETF (SPY)" published by Concretum founder Zarattini, along with Barbon and Aziz, in May 2024.
Below we provide all the information required to understand how the indicator is calculated, the rationale behind it and how people can use it.
Idea Behind
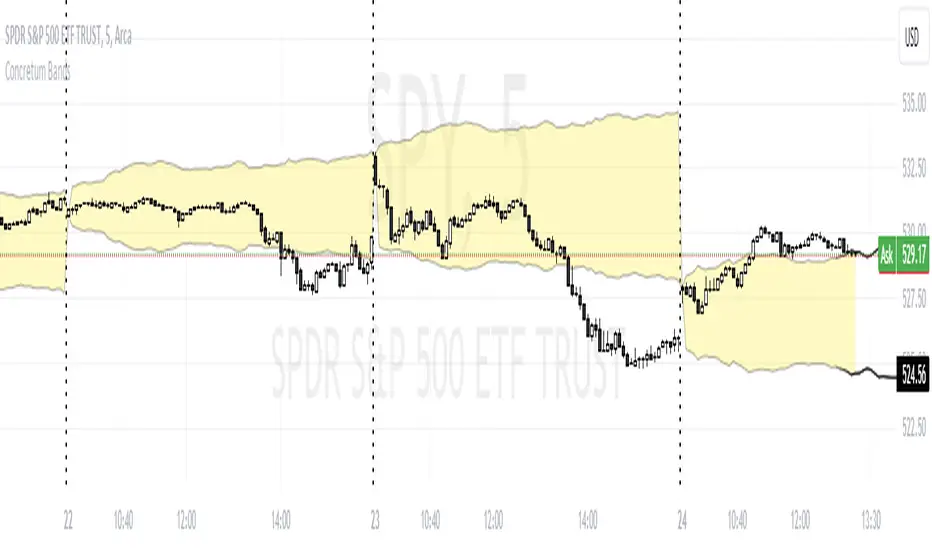
The indicator aims to outline an intraday price region where the stock is expected to move without indicating any demand/supply imbalance. When the price crosses the boundaries of the Noise Area, it suggests a significant imbalance that may trigger an intraday trend.
How the Indicator is Calculated
The bands at time HH:MM are computed by taking the open price of day t and then adding/subtracting the average absolute move over the last n days from market open to minute HH:MM. The bands are also adjusted to account for overnight gaps. A volatility multiplier can be used to increase/decrease the width of the bands, similar to other well-known technical bands. The bands described in the paper were computed using a lookback period (length) of 14 days and a Volatility Multiplier of 1. Users can easily adjust these settings.
How to use the indicator
A trader may use this indicator to identify intraday moves that exceed the average move over the most recent period. A break outside the bands could be used as a signal of significant demand/supply imbalance.
The Concretum Bands indicator recreates the Upper and Lower Bound of the Noise Area described in the paper "Beat the Market: An Effective Intraday Momentum Strategy for S&P500 ETF (SPY)" published by Concretum founder Zarattini, along with Barbon and Aziz, in May 2024.
Below we provide all the information required to understand how the indicator is calculated, the rationale behind it and how people can use it.
Idea Behind
The indicator aims to outline an intraday price region where the stock is expected to move without indicating any demand/supply imbalance. When the price crosses the boundaries of the Noise Area, it suggests a significant imbalance that may trigger an intraday trend.
How the Indicator is Calculated
The bands at time HH:MM are computed by taking the open price of day t and then adding/subtracting the average absolute move over the last n days from market open to minute HH:MM. The bands are also adjusted to account for overnight gaps. A volatility multiplier can be used to increase/decrease the width of the bands, similar to other well-known technical bands. The bands described in the paper were computed using a lookback period (length) of 14 days and a Volatility Multiplier of 1. Users can easily adjust these settings.
How to use the indicator
A trader may use this indicator to identify intraday moves that exceed the average move over the most recent period. A break outside the bands could be used as a signal of significant demand/supply imbalance.
開源腳本
秉持TradingView一貫精神,這個腳本的創作者將其設為開源,以便交易者檢視並驗證其功能。向作者致敬!您可以免費使用此腳本,但請注意,重新發佈代碼需遵守我們的社群規範。
免責聲明
這些資訊和出版物並非旨在提供,也不構成TradingView提供或認可的任何形式的財務、投資、交易或其他類型的建議或推薦。請閱讀使用條款以了解更多資訊。
開源腳本
秉持TradingView一貫精神,這個腳本的創作者將其設為開源,以便交易者檢視並驗證其功能。向作者致敬!您可以免費使用此腳本,但請注意,重新發佈代碼需遵守我們的社群規範。
免責聲明
這些資訊和出版物並非旨在提供,也不構成TradingView提供或認可的任何形式的財務、投資、交易或其他類型的建議或推薦。請閱讀使用條款以了解更多資訊。