OPEN-SOURCE SCRIPT
Ehlers Reflex Indicator [CC]
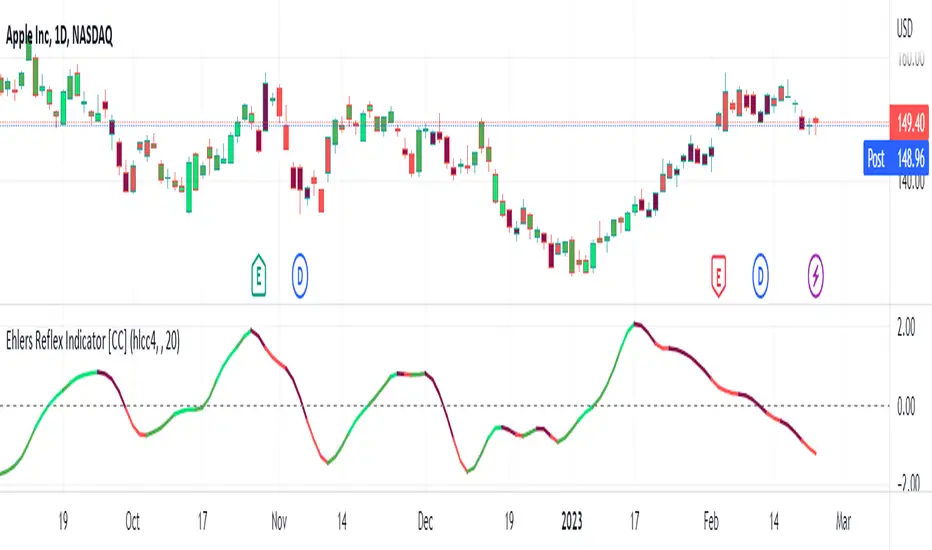
The Reflex Indicator was created by John Ehlers (Stocks and Commodities Feb 2020) and this is a zero lag indicator that works similar to an overbought/oversold indicator but with the current stock cycle data. I find that this indicator works well as a leading indicator as well as a divergence indicator. Generally speaking, this indicator indicates a medium to long term downtrend when the indicator is below the line and a medium to long term uptrend when the indicator is above the line. Ehlers has created a few complementary indicators that I will release in the next few days but just keep in mind that this indicator focuses on the underlying cycle component while removing as much noise with no lag. I have color coded the lines to show strong signals with the darker colors and normal signals with the lighter colors. Buy when the line turns green and sell when it turns red.
Let me know if there are any other scripts you would like to see me publish!
Let me know if there are any other scripts you would like to see me publish!
開源腳本
本著TradingView的真正精神,此腳本的創建者將其開源,以便交易者可以查看和驗證其功能。向作者致敬!雖然您可以免費使用它,但請記住,重新發佈程式碼必須遵守我們的網站規則。
I created the largest stock indicator library:
github.com/ooples/
Custom Indicator Requests:
forms.gle/ouMffZR3dQ8bSJQG7
Tips are appreciated:
paypal.me/cheatcountry
patreon.com/cheatcountry
github.com/ooples/
Custom Indicator Requests:
forms.gle/ouMffZR3dQ8bSJQG7
Tips are appreciated:
paypal.me/cheatcountry
patreon.com/cheatcountry
免責聲明
這些資訊和出版物並不意味著也不構成TradingView提供或認可的金融、投資、交易或其他類型的意見或建議。請在使用條款閱讀更多資訊。