INVITE-ONLY SCRIPT
LTPI Global Liquidity | JeffreyTimmermans

Long-Term Probability Indicator (LTPI)
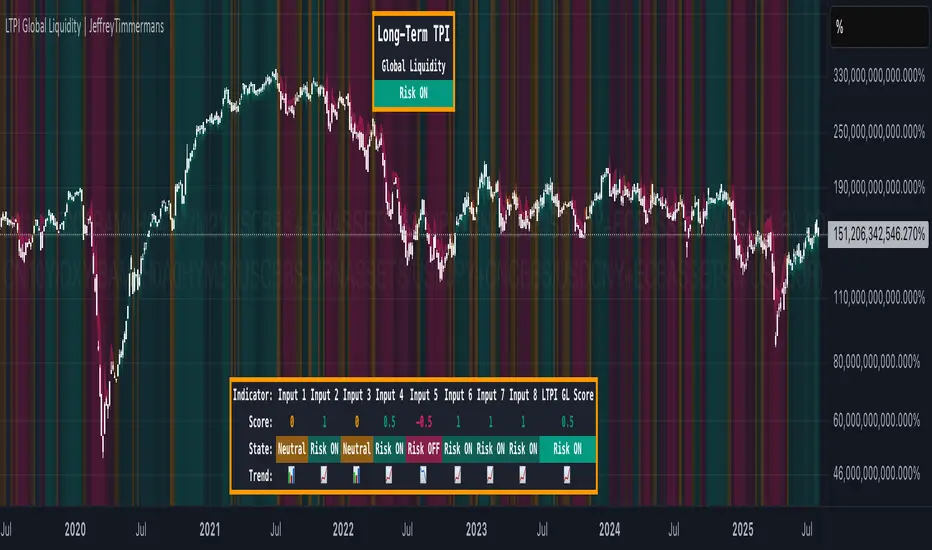
The "Long-Term Probability Indicator (LTPI)" on a generic liquidity ticker is a custom-built analytical tool designed to evaluate market conditions over a long-term horizon, with a strong focus on global liquidity trends. By combining six carefully selected input signals into a single probability score, this indicator helps traders and analysts identify prevailing long-term market states: Bullish, Bearish, or Neutral.
Where short-term systems/timeframes react quickly to price fluctuations, LTPI smooths out noise and focuses on the bigger picture, allowing for informed strategic decision-making rather than short-term speculation.
Key Features
Multi-Input Aggregation:
Long-Term Focus:
Simplified Market States:
Classifies the global market into three primary states:
Background Coloring:
Global Liquidity Perspective:
Dashboard Display:
Dynamic Alerts:
Inputs & Settings
LTPI Inputs:
Score Calculation:
Color Settings:
(Colors can be customized.)
Calculation Process
Collect Data:
Scoring:
Aggregate Probability:
Market Classification:
Background Coloring:
How to Use LTPI
Strategic Positioning:
Confirmation Tool:
Dynamic Alerts:
These alerts help identify significant macro-driven shifts in market conditions.
Conclusion
The Long-Term Probability Indicator (LTPI) is an advanced, liquidity-focused tool for identifying macro-driven market phases. By consolidating six inputs into a single probability score and presenting the results visually, LTPI helps long-term investors and analysts stay aligned with global liquidity trends and avoid being distracted by short-term volatility.
The "Long-Term Probability Indicator (LTPI)" on a generic liquidity ticker is a custom-built analytical tool designed to evaluate market conditions over a long-term horizon, with a strong focus on global liquidity trends. By combining six carefully selected input signals into a single probability score, this indicator helps traders and analysts identify prevailing long-term market states: Bullish, Bearish, or Neutral.
Where short-term systems/timeframes react quickly to price fluctuations, LTPI smooths out noise and focuses on the bigger picture, allowing for informed strategic decision-making rather than short-term speculation.
Key Features
Multi-Input Aggregation:
- Uses six independent inputs, each based on long-term liquidity and macro-related data, to generate a composite market probability score.
Long-Term Focus:
- Prioritizes medium-to-long-term trends, ignoring smaller fluctuations that often mislead traders in volatile markets.
Simplified Market States:
Classifies the global market into three primary states:
- Bullish: Favorable liquidity and conditions for long-term risk-taking.
- Bearish: Tightening liquidity and conditions that require caution.
- Neutral: Transitional phases or uncertain conditions.
Background Coloring:
- Visual cues on the chart help identify which regime is active at a glance.
Global Liquidity Perspective:
- Designed for use on a generic liquidity ticker, based on M2 money supply, to track macroeconomic liquidity flows and risk appetite.
Dashboard Display:
- A compact on-screen table summarizes all six inputs, their states, and the resulting LTPI score.
Dynamic Alerts:
- Real-time alerts signal when the LTPI shifts from one regime to another.
Inputs & Settings
LTPI Inputs:
- Input Sources (6): Each input is a carefully chosen trend following indicator.
- Weighting: Each input contributes equally to the final score.
Score Calculation:
- Bullish = +1
- Bearish = -1
- Neutral = 0
Color Settings:
- Strong Bullish: Bright Green
- Weak Bullish: Light Green
- Neutral: Gray/Orange
- Weak Bearish: Light Red
- Strong Bearish: Bright Red
(Colors can be customized.)
Calculation Process
Collect Data:
- Six long-term inputs are evaluated at each bar.
Scoring:
- Each input’s state contributes +1 (bullish), -1 (bearish), or around 0 (neutral).
Aggregate Probability:
- The LTPI Score is calculated as the sum of all six scores divided by 6, resulting in a value between -1 and +1.
Market Classification:
- Score > 0.1: Bullish regime
- Score < -0.1: Bearish regime
- -0.1 ≤ Score ≤ 0.1: Neutral
Background Coloring:
- Background colors are applied to highlight the current regime.
How to Use LTPI
Strategic Positioning:
- Bullish: Favor holding or adding to long-term positions.
- Bearish: Reduce risk, protect capital.
- Neutral: Wait for confirmation before making significant moves.
Confirmation Tool:
- LTPI works best when combined with shorter-term indicators like MTPI or trend-following tools to confirm alignment across multiple timeframes.
Dynamic Alerts:
- Bullish Regime Entry: When the LTPI Score crosses above 0.1.
- Bearish Regime Entry: When the LTPI Score crosses below -0.1.
- Neutral Zone: When the score moves back between -0.1 and 0.1.
These alerts help identify significant macro-driven shifts in market conditions.
Conclusion
The Long-Term Probability Indicator (LTPI) is an advanced, liquidity-focused tool for identifying macro-driven market phases. By consolidating six inputs into a single probability score and presenting the results visually, LTPI helps long-term investors and analysts stay aligned with global liquidity trends and avoid being distracted by short-term volatility.
僅限邀請腳本
僅作者批准的使用者才能訪問此腳本。您需要申請並獲得使用許可,通常需在付款後才能取得。更多詳情,請依照作者以下的指示操作,或直接聯絡JeffreyTimmermans。
TradingView不建議在未完全信任作者並了解其運作方式的情況下購買或使用腳本。您也可以在我們的社群腳本中找到免費的開源替代方案。
作者的說明
This script is invite-only. Think you deserve access to this indicator? Feel free to contact me.
@JeffreyTimmermans
免責聲明
這些資訊和出版物並非旨在提供,也不構成TradingView提供或認可的任何形式的財務、投資、交易或其他類型的建議或推薦。請閱讀使用條款以了解更多資訊。