OPEN-SOURCE SCRIPT
SuperTrend Momentum Table
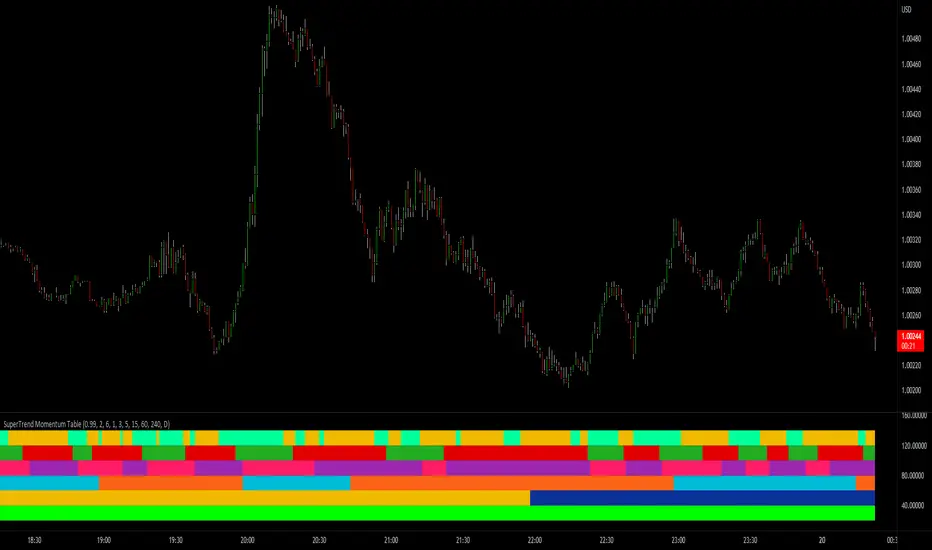
My goal creating this indicator : Provide a way to see the Past and Current Momentum of multiple different timeframes without using multiple charts.
The Underlying Concept / What is Momentum?
The Momentum shown is derived from a Mathematical Formula, SUPERTREND. When price closes above Supertrend Its bullish Momentum when its below Supertrend its Bearish Momentum.This indicator scans for bullish & bearish Momentum on the Timeframes selected by the user and when there is a shift in momentum on any of those time frames (price closes below or above SUPERTREND ) it notifies the trader with a color change on the Momentum Table.
Back Testing: This indicator will be key for back testing with the SuperTrend-Support-Resistance indicator

since the SuperTrend Momentum Table shows you the visual shift in momentum. Giving the Trader a Clear visual on how Each Support and Resistance Level was made .

Technical Inputs
- If you want to optimize the rate of signals to better fit your trading plan you would change the Factor input and ATR Length input. Increase factor and ATR Length to decrease the frequency of signals and decrease the Factor and ATR Length to increase the frequency of signals.
Quick TIP! : You can Sync all VFX SuperTrend Indicators together! All VFX SuperTrend indicators display unique information but its all derived from that same Momentum Formula. Keep the Factor input and ATR Length the same on other VFX SuperTrend indicators to have them operating on the same data.
Timeframe Inputs
- The indicator has 7 Time frame Displays where you can choose which Time Frames you would like to monitor.
- You can limit the amount of time frames being displayed by changing the Time Frame Amount

Display Inputs
- The trader can specify the bullish and bearish color of all 7 Timeframes
- You can toggle (on or off) the Momentum Switch if you want to highlight the exact candle where momentum switched from bullish to bearish and from bearish to bullish .

How it can be Used ? Check the momentum of other Timeframes and use that information as a variable to structure your trading plan.
- Use Momentum information to track the trend
- Plan and limit trades based on the current Momentum of multiple timeframes
- See if you have higher momentum to fuel your trades
- See breakouts on Multiple Time Frames
The Underlying Concept / What is Momentum?
The Momentum shown is derived from a Mathematical Formula, SUPERTREND. When price closes above Supertrend Its bullish Momentum when its below Supertrend its Bearish Momentum.This indicator scans for bullish & bearish Momentum on the Timeframes selected by the user and when there is a shift in momentum on any of those time frames (price closes below or above SUPERTREND ) it notifies the trader with a color change on the Momentum Table.
Back Testing: This indicator will be key for back testing with the SuperTrend-Support-Resistance indicator
since the SuperTrend Momentum Table shows you the visual shift in momentum. Giving the Trader a Clear visual on how Each Support and Resistance Level was made .
Technical Inputs
- If you want to optimize the rate of signals to better fit your trading plan you would change the Factor input and ATR Length input. Increase factor and ATR Length to decrease the frequency of signals and decrease the Factor and ATR Length to increase the frequency of signals.
Quick TIP! : You can Sync all VFX SuperTrend Indicators together! All VFX SuperTrend indicators display unique information but its all derived from that same Momentum Formula. Keep the Factor input and ATR Length the same on other VFX SuperTrend indicators to have them operating on the same data.
Timeframe Inputs
- The indicator has 7 Time frame Displays where you can choose which Time Frames you would like to monitor.
- You can limit the amount of time frames being displayed by changing the Time Frame Amount
Display Inputs
- The trader can specify the bullish and bearish color of all 7 Timeframes
- You can toggle (on or off) the Momentum Switch if you want to highlight the exact candle where momentum switched from bullish to bearish and from bearish to bullish .
How it can be Used ? Check the momentum of other Timeframes and use that information as a variable to structure your trading plan.
- Use Momentum information to track the trend
- Plan and limit trades based on the current Momentum of multiple timeframes
- See if you have higher momentum to fuel your trades
- See breakouts on Multiple Time Frames
開源腳本
本著TradingView的真正精神,此腳本的創建者將其開源,以便交易者可以查看和驗證其功能。向作者致敬!雖然您可以免費使用它,但請記住,重新發佈程式碼必須遵守我們的網站規則。
免責聲明
這些資訊和出版物並不意味著也不構成TradingView提供或認可的金融、投資、交易或其他類型的意見或建議。請在使用條款閱讀更多資訊。
開源腳本
本著TradingView的真正精神,此腳本的創建者將其開源,以便交易者可以查看和驗證其功能。向作者致敬!雖然您可以免費使用它,但請記住,重新發佈程式碼必須遵守我們的網站規則。
免責聲明
這些資訊和出版物並不意味著也不構成TradingView提供或認可的金融、投資、交易或其他類型的意見或建議。請在使用條款閱讀更多資訊。