PROTECTED SOURCE SCRIPT
Volume Bubbles Delta Coloring Classic V1.0
OVERVIEW
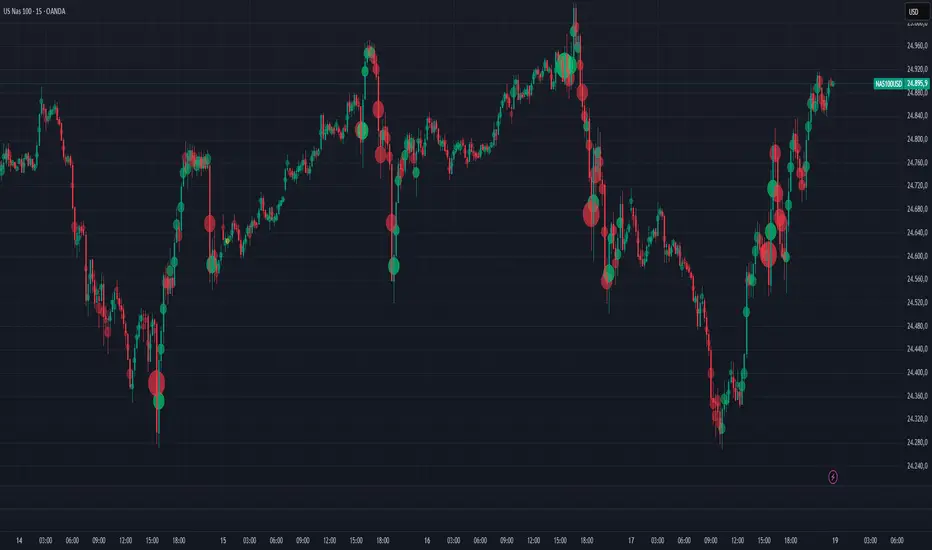
Bubbles Volume — Classic plots volume bubbles directly on the price chart. Bubble size scales with normalized volume, helping to visualize where trading activity concentrates. Optional heatmap coloring and significant-volume levels are included.
HOW IT WORKS
• Normalizes volume by its standard deviation to highlight unusually high participation.
• Draws circles ("bubbles") whose size corresponds to the normalized volume.
• Optional heatmap gradient emphasizes different volume regimes.
• Optional significant levels display labels or horizontal lines at the highest-volume bars.
INPUTS
• Bubbles / Threshold — Enable bubbles and set volume sensitivity.
• HeatMap — Enable gradient coloring by volume intensity.
• Significant Levels — Display labels or lines for the strongest volume bars.
• Levels Qty — Limit the number of labels or lines to display.
USE CASES
• Identify bars with unusually high trading activity.
• Spot reaction zones where large participants may have acted.
• Complement to price structure and trend analysis.
NOTES
• Uses chart volume only — not bid/ask orderflow.
• Visualization and educational tool, not a signal generator.
• Reduce visible bars if performance slows down.
CREDITS
Original concept by BigBeluga. Published under CC BY-NC-SA 4.0 license.
This is the unmodified, reference version.
受保護腳本
此腳本以閉源形式發佈。 不過,您可以自由使用,沒有任何限制 — 點擊此處了解更多。
免責聲明
這些資訊和出版物並非旨在提供,也不構成TradingView提供或認可的任何形式的財務、投資、交易或其他類型的建議或推薦。請閱讀使用條款以了解更多資訊。
受保護腳本
此腳本以閉源形式發佈。 不過,您可以自由使用,沒有任何限制 — 點擊此處了解更多。
免責聲明
這些資訊和出版物並非旨在提供,也不構成TradingView提供或認可的任何形式的財務、投資、交易或其他類型的建議或推薦。請閱讀使用條款以了解更多資訊。