OPEN-SOURCE SCRIPT
Variable Index Dynamic Average (VIDYA) with Histper
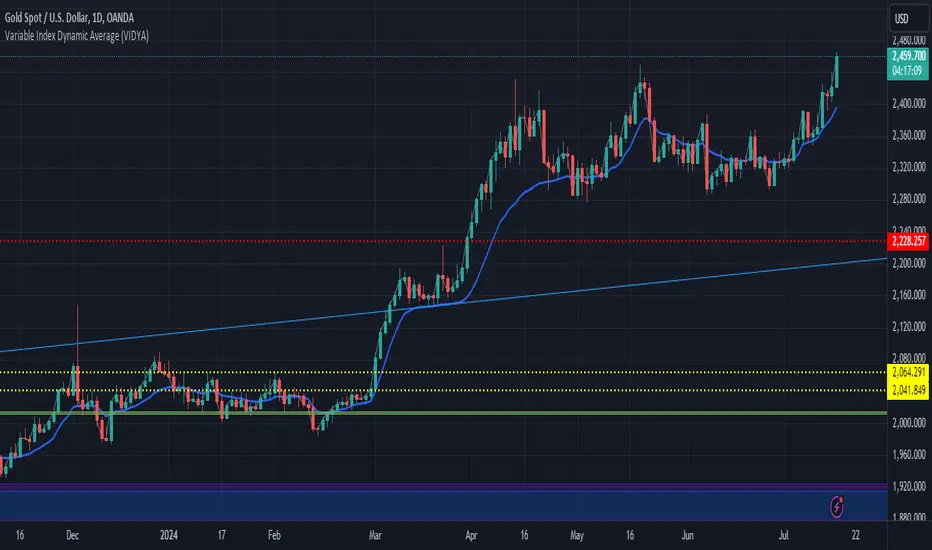
The Variable Index Dynamic Average (VIDYA) is a unique and adaptive moving average indicator designed to respond dynamically to market volatility. It adjusts its smoothing factor based on the standard deviation of price changes, making it more responsive during periods of high volatility and smoother during periods of low volatility. This version includes two key parameters:
Period: The number of bars used to calculate the VIDYA.
HistPer: The number of historical bars used to calculate the standard deviation, affecting the smoothness and responsiveness of the indicator.
Features:
Dynamic Adaptation: VIDYA adjusts its responsiveness based on market conditions, providing a balance between smoothness and responsiveness.
Customizable Parameters: Users can customize the Period and HistPer to fit their specific trading style and asset characteristics.
Overlay on Price Chart: The VIDYA is plotted directly on the price chart for easy visualization and integration with other technical analysis tools.
Usage:
Trend Identification: Use VIDYA to identify the prevailing trend. A rising VIDYA line indicates an uptrend, while a falling VIDYA line indicates a downtrend.
Entry and Exit Signals: Combine VIDYA with other indicators and trading strategies to confirm entry and exit signals.
Volatility Analysis: Adjust the HistPer to see how the indicator responds to different levels of market volatility.
開源腳本
秉持TradingView一貫精神,這個腳本的創作者將其設為開源,以便交易者檢視並驗證其功能。向作者致敬!您可以免費使用此腳本,但請注意,重新發佈代碼需遵守我們的社群規範。
免責聲明
這些資訊和出版物並非旨在提供,也不構成TradingView提供或認可的任何形式的財務、投資、交易或其他類型的建議或推薦。請閱讀使用條款以了解更多資訊。
免責聲明
這些資訊和出版物並非旨在提供,也不構成TradingView提供或認可的任何形式的財務、投資、交易或其他類型的建議或推薦。請閱讀使用條款以了解更多資訊。