OPEN-SOURCE SCRIPT
Gap Line
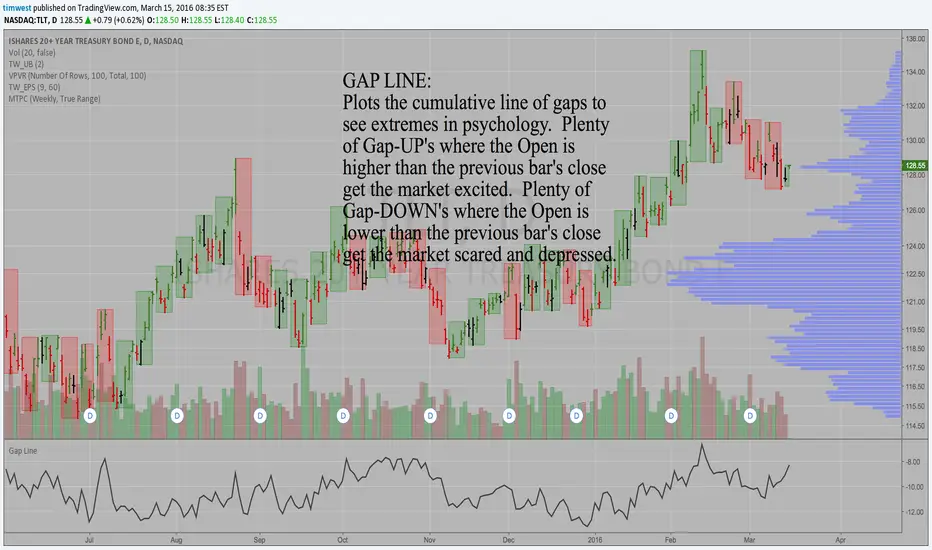
GAP LINE:
Plots the cumulative line of gaps to see extremes in psychology.
Plenty of Gap-UP's where the Open is higher than the previous bar's close get the market excited.
Plenty of Gap-DOWN's where the Open is lower than the previous bar's close get the market scared and depressed.
Look for the Gap Line to peak prior to an important peak in the market and vice versa. Look for a low in the Gap Line prior to an important low in the market.
Simple, but effective.
Tim
開源腳本
本著TradingView的真正精神,此腳本的創建者將其開源,以便交易者可以查看和驗證其功能。向作者致敬!雖然您可以免費使用它,但請記住,重新發佈程式碼必須遵守我們的網站規則。
Subscribe to my indicator package KEY HIDDEN LEVELS $10/mo or $100/year and join me in the trading room KEY HIDDEN LEVELS here at TradingView.com
免責聲明
這些資訊和出版物並不意味著也不構成TradingView提供或認可的金融、投資、交易或其他類型的意見或建議。請在使用條款閱讀更多資訊。
開源腳本
本著TradingView的真正精神,此腳本的創建者將其開源,以便交易者可以查看和驗證其功能。向作者致敬!雖然您可以免費使用它,但請記住,重新發佈程式碼必須遵守我們的網站規則。
免責聲明
這些資訊和出版物並不意味著也不構成TradingView提供或認可的金融、投資、交易或其他類型的意見或建議。請在使用條款閱讀更多資訊。