Dest123

VolumeVsVSMAComparison

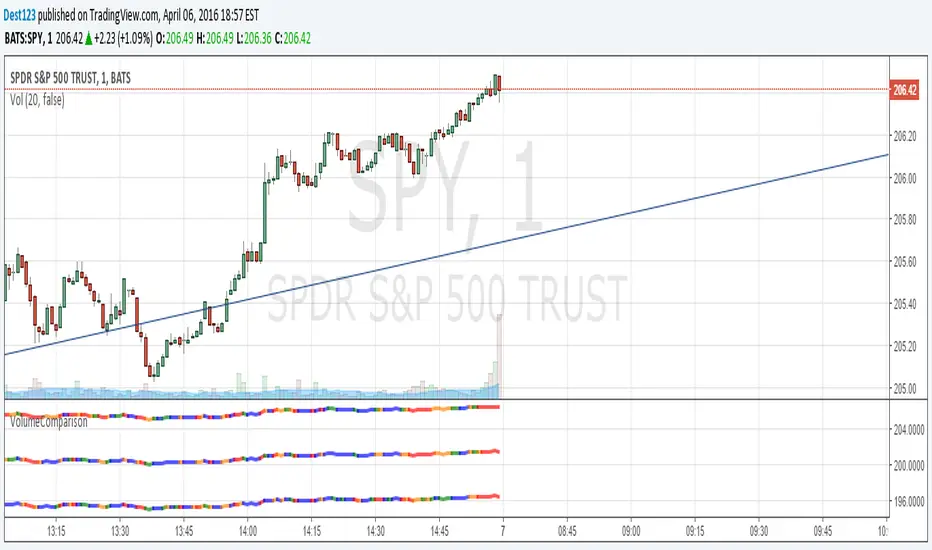
Shows 3 bars. One for the 100sma, one for 25sma, and one for 5sma. The bar color is blue if it's "low volume" compared to the sma, green if it's about average, yellow if it's high, and red if it's very high.

Top bar is 100sma, middle is 25, and bottom is 5
開源腳本

本著真正的TradingView精神,該腳本的作者將其開源發布,以便交易者可以理解和驗證它。為作者喝彩吧!您可以免費使用它,但在出版物中重複使用此代碼受網站規則的約束。 您可以收藏它以在圖表上使用。

免責聲明

這些資訊和出版物並不意味著也不構成TradingView提供或認可的金融、投資、交易或其他類型的意見或建議。請在使用條款閱讀更多資訊。

想在圖表上使用此腳本?
//@version=2
study("VolumeVsVSMAComparison")
//strategy("Testing")

//changePosition(up) =>
  //  strategy.close_all()
//    up ? strategy.entry("buy", strategy.long, 10) : strategy.entry("sell", strategy.short, 10)
  //  up

smaVal = 100
lowVolume = volume < sma(volume,smaVal)*0.8
highVolume = volume > sma(volume,smaVal)*1.5
mediumHighVolume = volume > sma(volume,smaVal)*1

smaVal2 = 25
lowVolume2 = volume < sma(volume,smaVal2)*0.8
highVolume2 = volume > sma(volume,smaVal2)*1.5
mediumHighVolume2 = volume > sma(volume,smaVal2)*1

smaVal3 = 5
lowVolume3 = volume < sma(volume,smaVal3)*0.8
highVolume3 = volume > sma(volume,smaVal3)*1.5
mediumHighVolume3 = volume > sma(volume,smaVal3)*1

change = sma((close-open),1)
goingUp = ((change > change[1]))// and (change[1] > change[2]))

plot(close,"", lowVolume ? blue : highVolume ? red : mediumHighVolume ? orange : green, linewidth=3)
plot(close-5,"", lowVolume2 ? blue : highVolume2 ? red : mediumHighVolume2 ? orange : green, linewidth=3)
plot(close-10,"", lowVolume3 ? blue : highVolume3 ? red : mediumHighVolume3 ? orange : green, linewidth=3)

//changePosition(goingUp)
//if (not na(goingUp[1]))
    //if (goingUp != goingUp[1])
        //if ((lowVolume[1] or lowVolume[2]) and highVolume) or (highVolume[1] and not highVolume)
        //if goingUp
            //strategy.entry("buy", strategy.long, strategy.position_size == 0 ? 10 : 20)
        //else
//            strategy.entry("sell", strategy.short, strategy.position_size == 0 ? 10 : 20)

//plot(strategy.equity, "", blue)
//plot(strategy.netprofit+100)
//plot(close, "", (goingUp ? green : red))
//plot(open, "", (((sma(open,3) > sma(open,3)[1]) and (sma(open,3)[1] > sma(open,3)[2])) ? green : red))

//plot(macd, color=blue)
//plot(signal, color=orange)