PROTECTED SOURCE SCRIPT
已更新 5 Magic Numbers CB7

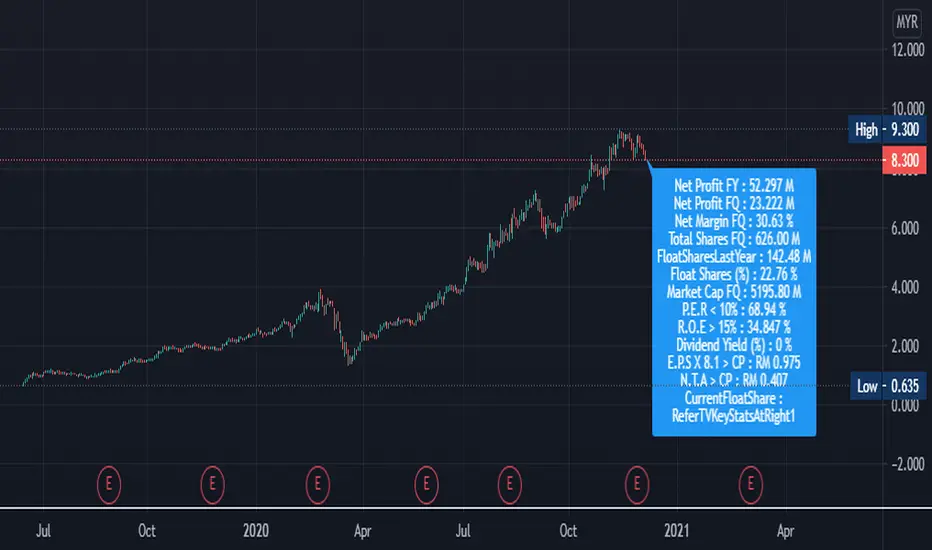
This script is actually 5 magic numbers and other data that being extract from TradingView itself for Bursa Market. Make it easy for us to read the data. Hopefully we can succeed together in our Trading Life
發行說明
Additional Float Public Shares Percentage%.Easily getting data and making decision
"FQ = FQ means the financial year of Latest Quarter Report Data"
"FY = FY means the financial year of Latest Last Year Data"
"TTM = TTM means the financial year of Latest past 12 consecutive months of a company’s performance data"
Net Profit Y : FY
Net Profit Qcurrent : FQ
Net Margin Q (%) : FQ
Total Shares : FQ
Float Public shares : FY
Market Cap : Current Value
P.E.R < 10% : FY
R.O.E Cap > 15% :FY
Dividend Yield (%) :FY
E.P.S X 8.1 < Current Price ( RM ) :TTM
N.T.A < Current Price ( RM ) :FQ
發行說明
Do Follow To get Latest UpdateEasily getting data and making decision
"FQ = FQ means the financial year of Latest Quarter Report Data"
"FY = FY means the financial year of Latest Last Year Data"
"TTM = TTM means the financial year of Latest past 12 consecutive months of a company’s performance data"
Net Profit Y : FY
Net Profit Qcurrent : FQ
Net Margin Q (%) : FQ
Total Shares : FQ
Float Public shares : FY
Market Cap : Current Value
P.E.R < 10% : FY
R.O.E Cap > 15% :FY
Dividend Yield (%) :FY
E.P.S X 8.1 < Current Price ( RM ) :TTM
N.T.A < Current Price ( RM ) :FQ
發行說明
UPDATED R.O.E , P.E.R , Float Share, Float share number is from last year, for current float share you can get see on the right of trading view.We cannot grab the data. If anybody knows, tell us.
受保護腳本
此腳本以閉源形式發佈。 不過,您可以自由使用,沒有任何限制 — 點擊此處了解更多。
免責聲明
這些資訊和出版物並非旨在提供,也不構成TradingView提供或認可的任何形式的財務、投資、交易或其他類型的建議或推薦。請閱讀使用條款以了解更多資訊。
受保護腳本
此腳本以閉源形式發佈。 不過,您可以自由使用,沒有任何限制 — 點擊此處了解更多。
免責聲明
這些資訊和出版物並非旨在提供,也不構成TradingView提供或認可的任何形式的財務、投資、交易或其他類型的建議或推薦。請閱讀使用條款以了解更多資訊。