OPEN-SOURCE SCRIPT
已更新 (mab) ATR Band
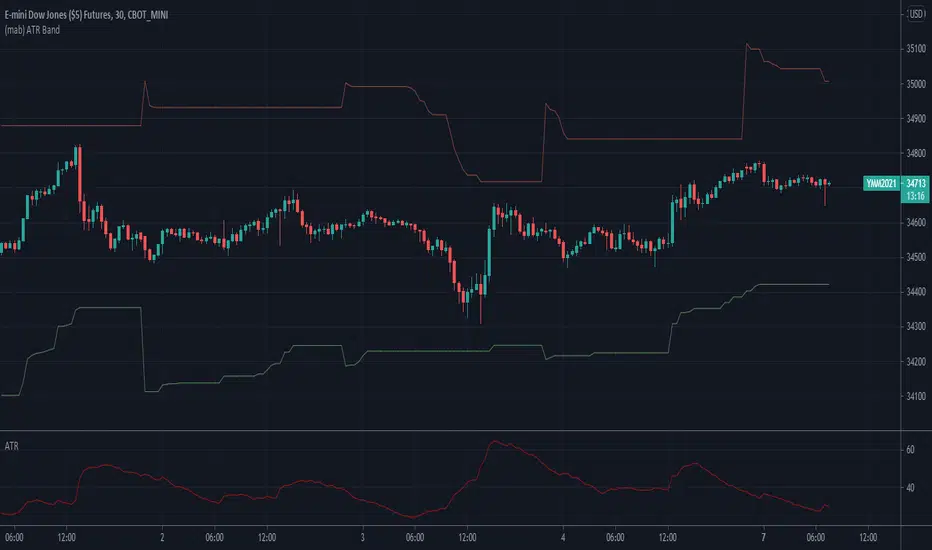
Simple ATR band as overlay on price chart.
發行說明
This updated version is more advanced. It plots a simple ATR band on daily and higher time frames. On intraday charts it can plot a dynamic band that takes the previous days ATR as starting point. At new lows it lowers the upper band to the new low plus the previous days ATR. At new highs it rises the lower band to the new high minus the previous days ATR.發行說明
This update enhances the (mab) ATR Band indicator with multi time frame capabilities. If "Floating daily ATR on intraday charts" is enabled, it shows the previous days ATR value as a starting point at the start of the session on intraday charts. At new lows it lowers the upper band to the new low plus the previous days ATR. At new highs it rises the lower band to the new high minus the previous days ATR.Similarly if "Floating weekly/monthly ATR on daily/weekly charts" is enabled, it shows the previous weeks ATR as starting point on daily charts and the previous months ATR on weekly charts. At new lows it lowers the upper band to the new low plus the previous weeks/moths ATR. At new highs it rises the lower band to the new high minus the previous weeks/months ATR.
開源腳本
秉持TradingView一貫精神,這個腳本的創作者將其設為開源,以便交易者檢視並驗證其功能。向作者致敬!您可以免費使用此腳本,但請注意,重新發佈代碼需遵守我們的社群規範。
免責聲明
這些資訊和出版物並非旨在提供,也不構成TradingView提供或認可的任何形式的財務、投資、交易或其他類型的建議或推薦。請閱讀使用條款以了解更多資訊。
免責聲明
這些資訊和出版物並非旨在提供,也不構成TradingView提供或認可的任何形式的財務、投資、交易或其他類型的建議或推薦。請閱讀使用條款以了解更多資訊。