PROTECTED SOURCE SCRIPT
已更新 Range support and resistance
Welcome all
==========
This script specially is for Kunal Saraogi Senani Traders and beginners.
.
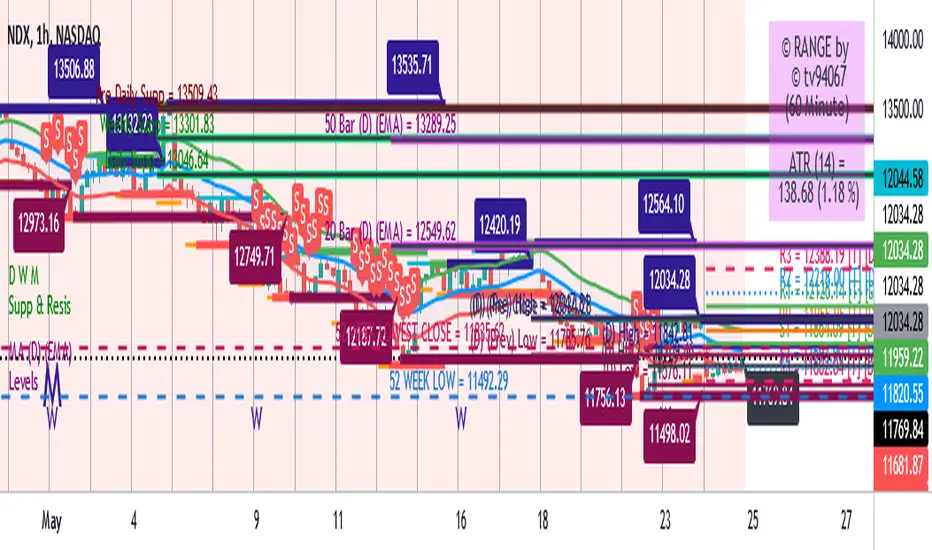
With this script you can find support and resistance for input range on any time-frame chart.
You need not draw line by own. You just input your desired range and this script will do your work automatically.
You can adjust range according to your choice.
Also have an option to select range source which help you to find support and resistance on the basis of close price or high/low of input range. Default range source is close price.
.
Latest support and resistance value labels also display on the chart.
.
To use this script, add to favorite and apply on chart.
.
Feel free to comment your suggestions.
.
Thanks all
==========
This script specially is for Kunal Saraogi Senani Traders and beginners.
.
With this script you can find support and resistance for input range on any time-frame chart.
You need not draw line by own. You just input your desired range and this script will do your work automatically.
You can adjust range according to your choice.
Also have an option to select range source which help you to find support and resistance on the basis of close price or high/low of input range. Default range source is close price.
.
Latest support and resistance value labels also display on the chart.
.
To use this script, add to favorite and apply on chart.
.
Feel free to comment your suggestions.
.
Thanks all
發行說明
Added option to show ATR (default value 10 period)so that one can have better understanding of volatility and where to put stop loss.
.
please comment.
發行說明
.發行說明
.發行說明
ATR label location set發行說明
For better visibility of range, highlighted background is added for better understanding of support and resistance..
highlighted background color can be change from setting.
發行說明
New label position for better visibility. 發行說明
Fill between range (support and resistance) fixed發行說明
Some minor changes for better experience. 發行說明
Hello alladded
1. chart background is red when price below support
2. chart background is green when price above resistance
3. all numbers formatted to #.##
3. range fill with color (between support and resistance)
all modification will help to identify trend and direction of trade.
Thank you
發行說明
Minor fixes and improvements. 發行說明
Hello all.
1. One EMA is added
2. Price label become green when price is above resistance, red when below support, yellow when between support and resistance.
3. ATR is also shown on the chart to measure volatility.
發行說明
Hello all,new look and feel, new update brings ----
.
1. price line and label on chart. color is green when price is above resistance, red when below support and blue when between support and resistance.
2. Daily 20, 50, 100, 200 Exponential averages on intraday charts.
2. ATR label.
3. fix of lines disappear on some charts.
4. chart backgrounder color is green when price is above resistance, red when below support.
5. one EMA line on chart for trend identification.
and many more things.
.
feel free to comment for any doubt.
發行說明
Dear All.
Update brings new and advance feature.
code is shorten for fast processing.
.
Logic of trade is buy when close above high range and sell when close below low range, (first check high time frame range too)
.
Thanks all for appreciation.
發行說明
Hello All- color.new() in implemented
- fix with display lower high and lower low.
發行說明
Hello allnew update brings elegant look and bug fixes.
發行說明
Hello friends-
1. now you can select time-frame from settings to show different time-frame support and resistance on different charts.
2. see time-frame with resistance and support on the chart.
Like R(60) S(60), R(D) S(D) etc.
發行說明
Hello All-
- Improvements
- show / hide price label and lines
- price label and line color green when price above resistance, color is red when price is below support otherwise black.
- extend support and resistance lines.
發行說明
Hello All-
Updated to latest version 5
發行說明
Hello All-
Added option to on/off Fill between Support and Resistance
發行說明
Hello all.
some fix and improvements.
發行說明
Hello all, Happy New Year-
1. Different values to set range/pivot support and resistance. Default value is 15-8
2. Previous support and resistance lines can be draw on chart.
3. Some other improvements.
發行說明
Hello All---
New update brings new features and bug fixes.
發行說明
feature enhancement.發行說明
New update brings new features and fixes.-
feel free to ask if you have a question.
-
you are always welcome
受保護腳本
此腳本以閉源形式發佈。 不過,您可以自由使用,沒有任何限制 — 點擊此處了解更多。
免責聲明
這些資訊和出版物並非旨在提供,也不構成TradingView提供或認可的任何形式的財務、投資、交易或其他類型的建議或推薦。請閱讀使用條款以了解更多資訊。
免責聲明
這些資訊和出版物並非旨在提供,也不構成TradingView提供或認可的任何形式的財務、投資、交易或其他類型的建議或推薦。請閱讀使用條款以了解更多資訊。