OPEN-SOURCE SCRIPT
FREE INDICATOR: Laguerre Moving Average by TheLark
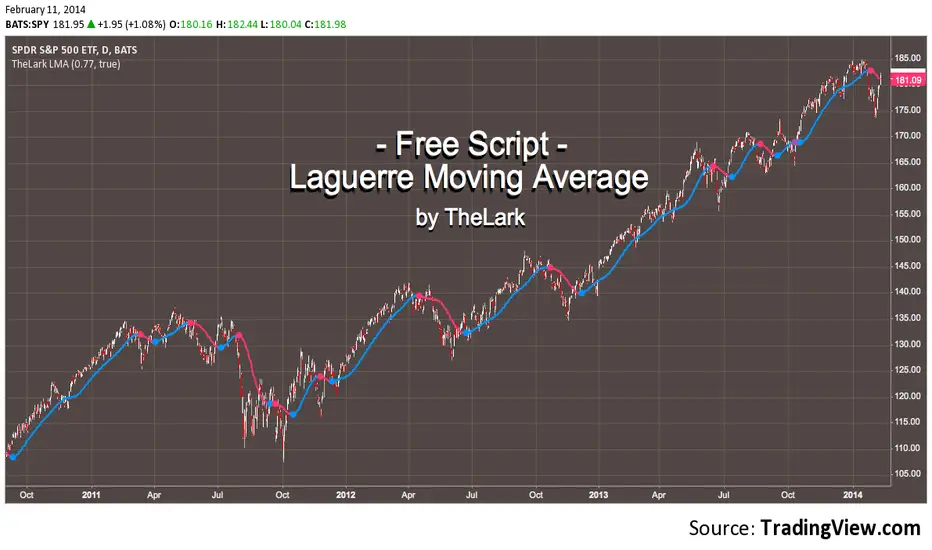
About:
The Laguerre Average was discovered by John Ehlers.
It's a newer type of averaging that is meant to take out as much of the inherent lag that your typical EMA and SMA's give at the start of a major trend change.
So what you get is an average that turns more quickly at major trend changes, and doesn't get tripped up on the noise (as much).
Usage:
Simply use this in place of EMA or SMA averages, and integrate with your trading style!
By changing the gamma, you change the "length", play with it to see how the average reacts to different inputs, find something you like and run with it!
You can turn off the trend change dots if desired.
Grab the code here: pastebin.com/kiMNGrkZ
·´¯`·.¸¸.·´¯`· Feel free to follow me to keep up with my latest scripts! ·´¯`·.¸¸.·´¯`·
·´¯`·.¸¸.·´¯`· PLEASE THUMB UP OR STAR IF YOU LIKE THIS INDICATOR! ·´¯`·.¸¸.·´¯`·
I'd like as many people as possible to get it :)
開源腳本
本著TradingView的真正精神,此腳本的創建者將其開源,以便交易者可以查看和驗證其功能。向作者致敬!雖然您可以免費使用它,但請記住,重新發佈程式碼必須遵守我們的網站規則。
相關出版品
免責聲明
這些資訊和出版物並不意味著也不構成TradingView提供或認可的金融、投資、交易或其他類型的意見或建議。請在使用條款閱讀更多資訊。
開源腳本
本著TradingView的真正精神,此腳本的創建者將其開源,以便交易者可以查看和驗證其功能。向作者致敬!雖然您可以免費使用它,但請記住,重新發佈程式碼必須遵守我們的網站規則。
相關出版品
免責聲明
這些資訊和出版物並不意味著也不構成TradingView提供或認可的金融、投資、交易或其他類型的意見或建議。請在使用條款閱讀更多資訊。