OPEN-SOURCE SCRIPT
RB — Rejection Blocks (Price Structure)
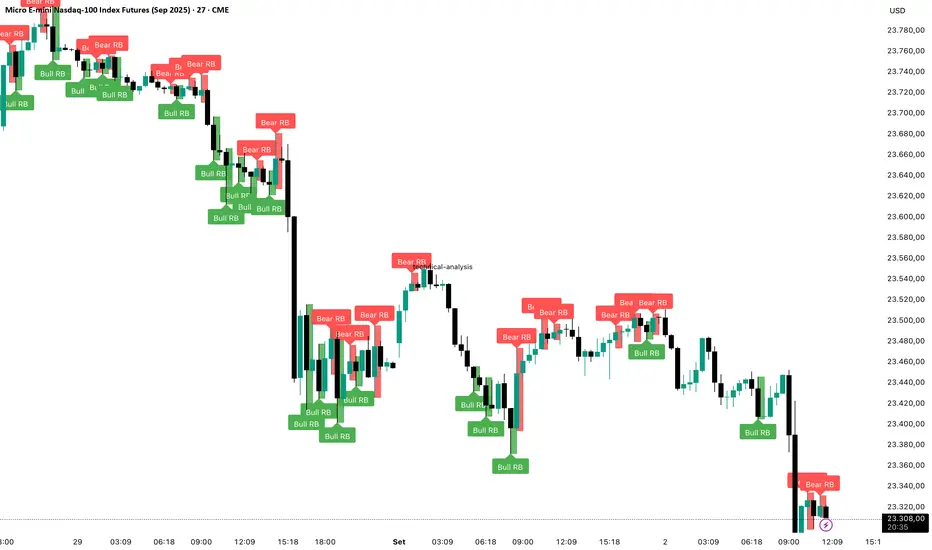
This indicator highlights potential Rejection Blocks (RB) from pure price structure.
What it does
• Detects bullish and bearish RBs using simple candle rules
• Draws zones as boxes, optional lines, and labels
• Keeps the chart readable with minimal, focused visuals
How it works
• Bullish RB: a down candle with a lower low than both the previous and the next candle
• Bearish RB: an up candle with a higher high than both the previous and the next candle
Use case
Useful for visually studying potential rejection areas and market structure on any timeframe.
Note
This tool is not a signal system; it’s a visual aid for discretionary analysis.
開源腳本
本著TradingView的真正精神,此腳本的創建者將其開源,以便交易者可以查看和驗證其功能。向作者致敬!雖然您可以免費使用它,但請記住,重新發佈程式碼必須遵守我們的網站規則。
免責聲明
這些資訊和出版物並不意味著也不構成TradingView提供或認可的金融、投資、交易或其他類型的意見或建議。請在使用條款閱讀更多資訊。
開源腳本
本著TradingView的真正精神,此腳本的創建者將其開源,以便交易者可以查看和驗證其功能。向作者致敬!雖然您可以免費使用它,但請記住,重新發佈程式碼必須遵守我們的網站規則。
免責聲明
這些資訊和出版物並不意味著也不構成TradingView提供或認可的金融、投資、交易或其他類型的意見或建議。請在使用條款閱讀更多資訊。