OPEN-SOURCE SCRIPT
Candlestick Strength and Weakness with RSI and OBV
The "Candlestick Strength and Weakness with RSI and OBV" indicator, denoted as CSW, is a tool designed to assist traders in identifying potential trend reversals in financial markets. The CSW indicator combines the analysis of candlestick patterns, relative strength index (RSI), and on-balance volume (OBV) to provide traders with valuable insights into market dynamics.
The CSW indicator calculates the strength and weakness of each candlestick based on its open, close, high, and low prices. It considers the body range, upper shadow range, and lower shadow range of the candlestick to determine the distribution of strength and weakness within it. By quantifying the candlestick's strength and weakness, the indicator provides a visual representation of the balance between bullish and bearish forces in the market.
In addition to candlestick analysis, the CSW indicator incorporates RSI and OBV calculations to further validate potential trend reversals. The RSI is a widely-used momentum oscillator that measures the speed and change of price movements. The OBV, on the other hand, tracks the cumulative volume flow and helps identify periods of accumulation or distribution. By considering these indicators alongside candlestick strength and weakness, the CSW indicator enhances the accuracy of its signals.
To interpret the CSW indicator effectively, traders should consider the following:
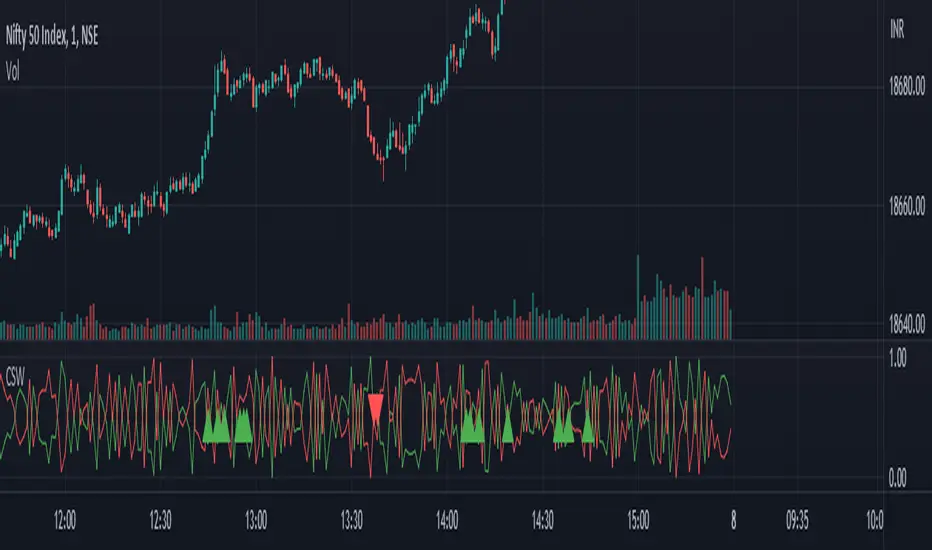
Candlestick Strength and Weakness: The indicator plots two lines, "Candle Strength" and "Candle Weakness," representing the strength and weakness of each candlestick. The strength line indicates the bullish pressure, while the weakness line represents the bearish pressure.
Potential Reversal Signals: The CSW indicator identifies potential trend reversals based on the balance between candlestick strength and weakness, RSI readings, and OBV values. A bullish reversal signal occurs when the strength is higher than weakness, the RSI is below 30 (indicating oversold conditions), and the OBV is below its 20-period simple moving average (SMA). Conversely, a bearish reversal signal occurs when the weakness is higher than strength, the RSI is above 70 (indicating overbought conditions), and the OBV is above its 20-period SMA.
Trend Confirmation: The CSW indicator provides additional confirmation by comparing the closing price with the 20-period exponential moving average (EMA). If the closing price is above the EMA, it suggests an uptrend, while a closing price below the EMA indicates a downtrend.
Traders can add the indicator to their charts and customize its parameters based on their preferences. By monitoring the indicator's plots and observing the occurrence of potential reversal signals in alignment with the trend confirmation, traders can make informed decisions regarding entry or exit points in their trading strategies.
The CSW indicator calculates the strength and weakness of each candlestick based on its open, close, high, and low prices. It considers the body range, upper shadow range, and lower shadow range of the candlestick to determine the distribution of strength and weakness within it. By quantifying the candlestick's strength and weakness, the indicator provides a visual representation of the balance between bullish and bearish forces in the market.
In addition to candlestick analysis, the CSW indicator incorporates RSI and OBV calculations to further validate potential trend reversals. The RSI is a widely-used momentum oscillator that measures the speed and change of price movements. The OBV, on the other hand, tracks the cumulative volume flow and helps identify periods of accumulation or distribution. By considering these indicators alongside candlestick strength and weakness, the CSW indicator enhances the accuracy of its signals.
To interpret the CSW indicator effectively, traders should consider the following:
Candlestick Strength and Weakness: The indicator plots two lines, "Candle Strength" and "Candle Weakness," representing the strength and weakness of each candlestick. The strength line indicates the bullish pressure, while the weakness line represents the bearish pressure.
Potential Reversal Signals: The CSW indicator identifies potential trend reversals based on the balance between candlestick strength and weakness, RSI readings, and OBV values. A bullish reversal signal occurs when the strength is higher than weakness, the RSI is below 30 (indicating oversold conditions), and the OBV is below its 20-period simple moving average (SMA). Conversely, a bearish reversal signal occurs when the weakness is higher than strength, the RSI is above 70 (indicating overbought conditions), and the OBV is above its 20-period SMA.
Trend Confirmation: The CSW indicator provides additional confirmation by comparing the closing price with the 20-period exponential moving average (EMA). If the closing price is above the EMA, it suggests an uptrend, while a closing price below the EMA indicates a downtrend.
Traders can add the indicator to their charts and customize its parameters based on their preferences. By monitoring the indicator's plots and observing the occurrence of potential reversal signals in alignment with the trend confirmation, traders can make informed decisions regarding entry or exit points in their trading strategies.
開源腳本
本著TradingView的真正精神,此腳本的創建者將其開源,以便交易者可以查看和驗證其功能。向作者致敬!雖然您可以免費使用它,但請記住,重新發佈程式碼必須遵守我們的網站規則。
免責聲明
這些資訊和出版物並不意味著也不構成TradingView提供或認可的金融、投資、交易或其他類型的意見或建議。請在使用條款閱讀更多資訊。
開源腳本
本著TradingView的真正精神,此腳本的創建者將其開源,以便交易者可以查看和驗證其功能。向作者致敬!雖然您可以免費使用它,但請記住,重新發佈程式碼必須遵守我們的網站規則。
免責聲明
這些資訊和出版物並不意味著也不構成TradingView提供或認可的金融、投資、交易或其他類型的意見或建議。請在使用條款閱讀更多資訊。