OPEN-SOURCE SCRIPT
Higher Timeframe Separator
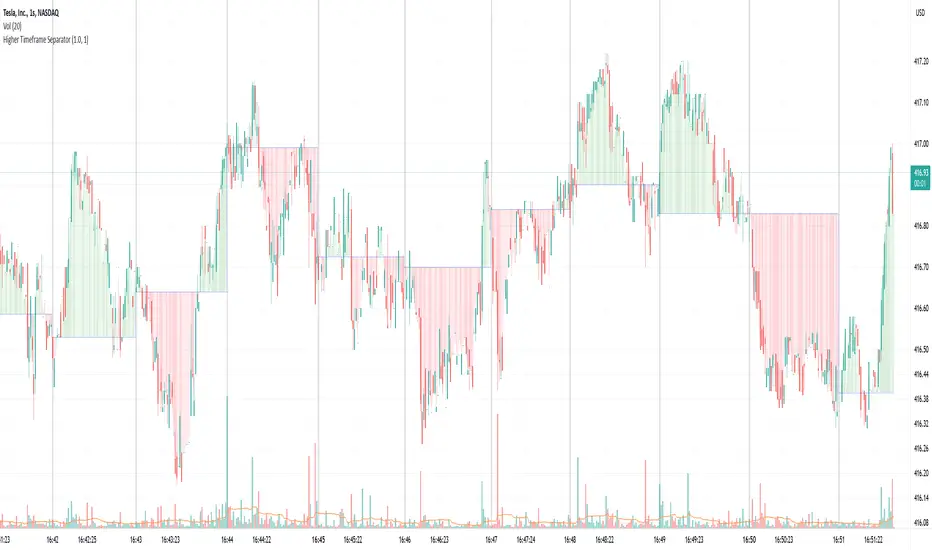
This script helps visually identify when a higher timeframe candle starts by drawing a vertical line. It also shades the area above or below the opening price, making it easier to track price movement relative to the higher timeframe.
Why It's Useful
If you use multiple timeframes, this indicator provides a clear visual reference for where the price is relative to the higher timeframe. This is much more convenient than constantly switching between charts. You can see in the screenshot below how much clearer the price action becomes when the indicator is enabled:

Additional Benefit
If you trade on a lower timeframe and notice that the number of bars between separators is inconsistent, it means there weren’t enough trades during that period—indicating low liquidity. Illiquid instruments can be riskier to trade. For example, observe how the vertical lines on the left side of the image below are densely packed:

Why It's Useful
If you use multiple timeframes, this indicator provides a clear visual reference for where the price is relative to the higher timeframe. This is much more convenient than constantly switching between charts. You can see in the screenshot below how much clearer the price action becomes when the indicator is enabled:
Additional Benefit
If you trade on a lower timeframe and notice that the number of bars between separators is inconsistent, it means there weren’t enough trades during that period—indicating low liquidity. Illiquid instruments can be riskier to trade. For example, observe how the vertical lines on the left side of the image below are densely packed:
開源腳本
秉持TradingView一貫精神,這個腳本的創作者將其設為開源,以便交易者檢視並驗證其功能。向作者致敬!您可以免費使用此腳本,但請注意,重新發佈代碼需遵守我們的社群規範。
免責聲明
這些資訊和出版物並非旨在提供,也不構成TradingView提供或認可的任何形式的財務、投資、交易或其他類型的建議或推薦。請閱讀使用條款以了解更多資訊。
免責聲明
這些資訊和出版物並非旨在提供,也不構成TradingView提供或認可的任何形式的財務、投資、交易或其他類型的建議或推薦。請閱讀使用條款以了解更多資訊。