INVITE-ONLY SCRIPT
已更新 Trading Guide v2

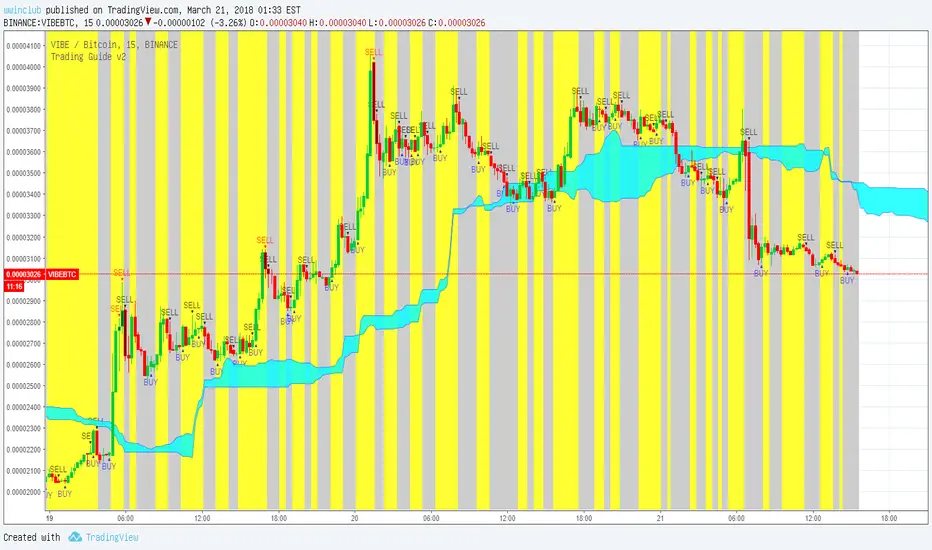
A yellow background means a rising section. A gray background means a falling section.
Basically, the ratio of BUY to SELL is that "SELL" had been set to be more frequent.
This is to minimize the damage in the event of a sudden drop in stock price, while at the peak of the stock between the BUY and the SELL, the SELL will be made at the peak.
BUY is blue, SELL is black, and the red SELL is the highest peak for SELL.
Candles changed to black are candles that are likely to update their peak, and red candles occur only in black candles.
If there is no "SELL" in the black candle, a black "SELL" will occur soon afterwards.
The reasons for adding the cloud to the chart are that the position of the sell will be different when the stock is above and below the cloud, so that it is easier for users to respond to the sell.
It is recommended to trade (SELL) on the yellow background above the clouds.
노란 배경은 상승구간 회색배경은 하락구간을 의미 합니다.
기본적으로 BUY와 SELL의 비율은 SELL이 약간 더 많도록 설정 하였습니다.
이는 BUY와 SELL의 사이에서 종목의 최고점이 발생 할 시에 최고점에서 SELL을 하기 위함과 동시에 갑작스러운 주가 하락시에 피해를 최소화 하기 위함입니다.
BUY는 파란색 SELL은 검은색이고 추가로 빨간 SELL은 최고점 확률이 높은 SELL입니다.
검은색으로 바뀐 캔들은 최고점을 경신 할 가능성이 높은 캔들이고 검은 캔들에서만 빨간색 SELL이 발생 합니다.
검은색 캔들에서 SELL이 뜨지 않는다면 이후에 곧 검은색 SELL이 발생 할 것입니다.
구름대를 지표에 같이 추가한 이유는 종목이 구름대 위에 있을때와 아래에 있을때 매도의 포지션이 달라지기 때문에이를 사용자들이 참고하여 매도에 더 쉽게 대응하기 위함입니다.
구름위의 노란배경에서 매매 하시는 것을 추천합니다.
發行說明
Basically, Buy and Sell signal will appear as 1:1. And we set up the system to give you an additional Sell signal at the highst price for short term which turns black candle.
This is version does repaint signals for Buy, Sell, and the extra Sell at the short term peak price. This means, we are unable to show you how this test version indicator works compared to the other one in terms of wealth management.
However, we do have a plan to update this indicator which will enable us to give you signals without repainting and eventually will allow us to compare total balance thru trading just like Basel major swing ver.
Link for Basel major swing ver : https://kr.tradingview.com/script/N94R9K0a/
───────────────────────────────────────────────────────────────────────────────────────────
기본적으로 Buy와 Sell이 1:1로 나타나도록 하였고 그 사이에 발생하는 단기추세 최고점에 봉이 검은색으로 변하면서 Sell 신호가 더 나오도록 구현하였습니다.
Buy와 Sell 단기고점 Sell 모든 신호에 리페인팅이 있는 버전이고 리페인팅이 있기 때문에 시드 관리가 어떻게 되는지 표시 할 수 없는 테스트 버전입니다.
위의 버전은 수정을 통해서 이후에 Basel major swing ver와 같이 리페인팅 없이 시드 관리내역 표시 및 시그널의 발생 시점을 봉에 표시하는 기능을 추가 할 예정 입니다.
Basel major swing ver 링크: https://kr.tradingview.com/script/N94R9K0a/
【 트레이딩뷰 매니아 】
cafe.naver.com/tradingviewmania
【 트레이딩 시스템 】
tradingviewmania-menu.oopy.io/
【 카톡 】
bit.ly/싸부_문의1
【 텔레그램 】
bit.ly/싸부텔레
cafe.naver.com/tradingviewmania
【 트레이딩 시스템 】
tradingviewmania-menu.oopy.io/
【 카톡 】
bit.ly/싸부_문의1
【 텔레그램 】
bit.ly/싸부텔레
免責聲明
這些資訊和出版物並不意味著也不構成TradingView提供或認可的金融、投資、交易或其他類型的意見或建議。請在使用條款閱讀更多資訊。


![[ssabu] self macd indicator](https://s3.tradingview.com/f/FQLmNRaa_mid.png)