OPEN-SOURCE SCRIPT
AT Ratio
AT Ratio
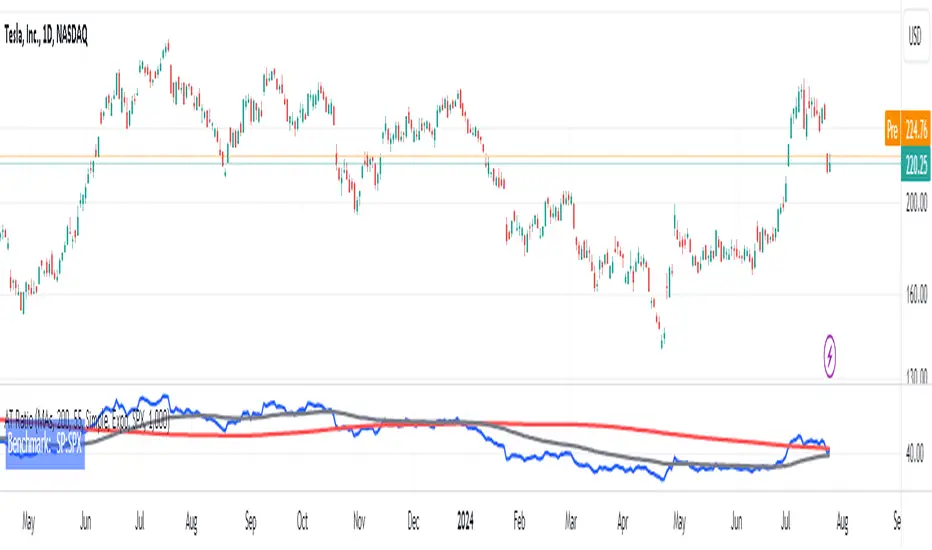
This indicator plots a ratio chart of 2 symbols, calculated as symbol1/symbol2.
The current chart symbol is used as symbol1.
A ratio chart allows to determine the relative strength of an asset compared to another asset.
It can be used for example to compare two stocks or a stock to its benchmark index, thus showing,
- if a stock has strength on its own (climbing ratio chart)
- if a stock just moves with the index (sideways ratio chart)
- if a stock is weaker than the index (falling ratio chart)
Inputs:
Style:
Plain: Only the ratio chart is plotted
MAs: Additional Moving Averages of the ratio chart are plotted
Perdiod Long: The period for the long MA
Perdiod Short: The period for the long MA
MA Type Long:
Simple: A simple MA is used
Expo: An exponential MA is used
MA Type Short:
Simple: A simple MA is used
Expo: An exponential MA is used
Ratio Symbol: The symbol to be used for symbol2
Factor: A factor the ratio value is multiplied by
Open-source script
開源腳本
秉持TradingView一貫精神,這個腳本的創作者將其設為開源,以便交易者檢視並驗證其功能。向作者致敬!您可以免費使用此腳本,但請注意,重新發佈代碼需遵守我們的社群規範。
免責聲明
這些資訊和出版物並非旨在提供,也不構成TradingView提供或認可的任何形式的財務、投資、交易或其他類型的建議或推薦。請閱讀使用條款以了解更多資訊。
免責聲明
這些資訊和出版物並非旨在提供,也不構成TradingView提供或認可的任何形式的財務、投資、交易或其他類型的建議或推薦。請閱讀使用條款以了解更多資訊。