PINE LIBRARY
pseudorenko
█ CALCULATE PSEUDO-RENKO VALUE
Calculates and returns the Pseudo-Renko Stabilized value (or close price) based on a given input value, along with the direction of the current Renko brick. This function adapts the traditional Renko brick size dynamically based on the volatility of the input value using a combination of SMA and EMA calculations. The calculated price represents the closing price of the most recent Pseudo-Renko brick, while the direction indicates the trend (1 for uptrend, -1 for downtrend).
Parameters:
* `val`:
* Type: `float`
* Description: The input value upon which the Pseudo-Renko calculations are performed. You can use any price series or custom value as input.
* `sensitivity`:
* Type: `float`
* Default Value: `1.0`
* Description: Controls the sensitivity of the brick size to the volatility of the `val`. Higher values lead to larger bricks, resulting in a smoother Renko chart. Lower values produce smaller bricks, leading to a more reactive chart.
* Possible Values: Any positive float.
* `length`:
* Type: `int`
* Default Value: `7`
* Description: The length used for calculating the EMA and SMA in the dynamic brick size calculation. It influences how quickly the brick size adapts to changing volatility of the `val`.
* Possible Values: Any positive integer.
Return Values:
* `lastRenkoClose`:
* Type: `float`
* Description: The closing price of the last completed Pseudo-Renko brick based on the `val`.
* `renkoDirection`:
* Type: `int`
* Description: The direction of the current Pseudo-Renko brick based on the `val`:
* `1`: Uptrend
* `-1`: Downtrend
* `0`: No change (initially, or no brick change since the previous bar)
Example Usage:
Pine Script®
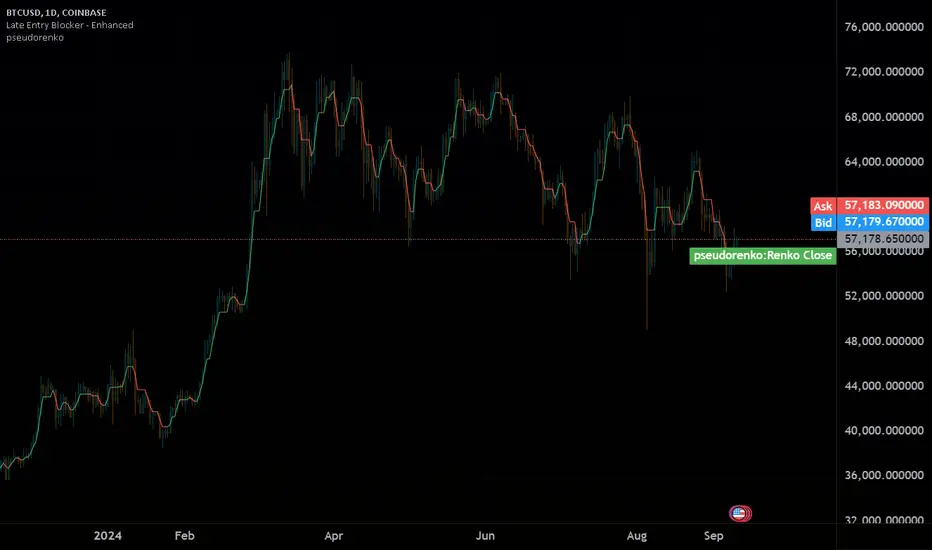
This example demonstrates how to use the `pseudo_renko` function within an indicator. It takes user inputs for `sensitivity` and `length`, then calculates the Pseudo-Renko values using the average of the `close` and `open` prices as the `val`. The resulting `renkoClose` price is plotted on the chart, with a color change based on the `renkoDirection`. It also illustrates how you can use other values, like `high` and `low`, as input to the function.
Note: The Pseudo-Renko algorithm is based on adapting the Renko brick size dynamically based on the input `val`. This provides more flexibility compared to the normal, but is experimental. The `sensitivity` and `length` parameters, along with the choice of the `val`, offer further customization to tune the algorithm's behavior to your preference and trading style.
Calculates and returns the Pseudo-Renko Stabilized value (or close price) based on a given input value, along with the direction of the current Renko brick. This function adapts the traditional Renko brick size dynamically based on the volatility of the input value using a combination of SMA and EMA calculations. The calculated price represents the closing price of the most recent Pseudo-Renko brick, while the direction indicates the trend (1 for uptrend, -1 for downtrend).
Parameters:
* `val`:
* Type: `float`
* Description: The input value upon which the Pseudo-Renko calculations are performed. You can use any price series or custom value as input.
* `sensitivity`:
* Type: `float`
* Default Value: `1.0`
* Description: Controls the sensitivity of the brick size to the volatility of the `val`. Higher values lead to larger bricks, resulting in a smoother Renko chart. Lower values produce smaller bricks, leading to a more reactive chart.
* Possible Values: Any positive float.
* `length`:
* Type: `int`
* Default Value: `7`
* Description: The length used for calculating the EMA and SMA in the dynamic brick size calculation. It influences how quickly the brick size adapts to changing volatility of the `val`.
* Possible Values: Any positive integer.
Return Values:
* `lastRenkoClose`:
* Type: `float`
* Description: The closing price of the last completed Pseudo-Renko brick based on the `val`.
* `renkoDirection`:
* Type: `int`
* Description: The direction of the current Pseudo-Renko brick based on the `val`:
* `1`: Uptrend
* `-1`: Downtrend
* `0`: No change (initially, or no brick change since the previous bar)
Example Usage:
//@version=5
indicator("Pseudo-Renko Stabilized (Val)", overlay=true)
// Get user inputs
sensitivityInput = input.float(0.1, "Sensitivity",0.01,step=0.01)
lengthInput = input.int(5, "Length",2)
// Example usage with the 'close' price as the input value
[renkoClose, renkoDirection] = pseudo_renko(math.avg(close,open), sensitivityInput, lengthInput)
// Plot the Renko close price
plot(renkoClose, "Renko Close", renkoDirection>0?color.aqua:color.orange,2)
// You can also use other values as input, such as:
// [renkoCloseHigh, renkoDirectionHigh] = pseudo_renko(high, sensitivityInput, lengthInput)
// [renkoCloseLow, renkoDirectionLow] = pseudo_renko(low, sensitivityInput, lengthInput)
This example demonstrates how to use the `pseudo_renko` function within an indicator. It takes user inputs for `sensitivity` and `length`, then calculates the Pseudo-Renko values using the average of the `close` and `open` prices as the `val`. The resulting `renkoClose` price is plotted on the chart, with a color change based on the `renkoDirection`. It also illustrates how you can use other values, like `high` and `low`, as input to the function.
Note: The Pseudo-Renko algorithm is based on adapting the Renko brick size dynamically based on the input `val`. This provides more flexibility compared to the normal, but is experimental. The `sensitivity` and `length` parameters, along with the choice of the `val`, offer further customization to tune the algorithm's behavior to your preference and trading style.
Pine腳本庫
秉持 TradingView 一貫的共享精神,作者將此 Pine 程式碼發佈為開源庫,讓社群中的其他 Pine 程式設計師能夠重複使用。向作者致敬!您可以在私人專案或其他開源發佈中使用此庫,但在公開發佈中重複使用該程式碼需遵守社群規範。
免責聲明
這些資訊和出版物並不意味著也不構成TradingView提供或認可的金融、投資、交易或其他類型的意見或建議。請在使用條款閱讀更多資訊。
Pine腳本庫
秉持 TradingView 一貫的共享精神,作者將此 Pine 程式碼發佈為開源庫,讓社群中的其他 Pine 程式設計師能夠重複使用。向作者致敬!您可以在私人專案或其他開源發佈中使用此庫,但在公開發佈中重複使用該程式碼需遵守社群規範。
免責聲明
這些資訊和出版物並不意味著也不構成TradingView提供或認可的金融、投資、交易或其他類型的意見或建議。請在使用條款閱讀更多資訊。