INVITE-ONLY SCRIPT
Pivot Points with Fibonacci Weekly
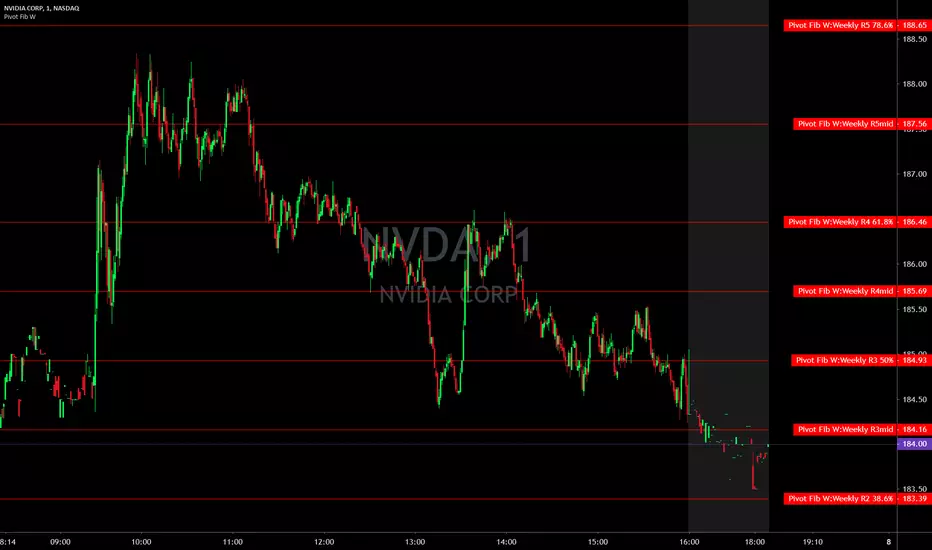
Pivot Points with Fibonacci
Weekly only
What is a Pivot Point?
A pivot point is a technical analysis indicator, or calculations, used to determine the overall trend of the market over different time frames. The pivot point itself is simply the average of the high, low and closing prices from the previous trading day. On the subsequent day, trading above the pivot point is thought to indicate ongoing bullish sentiment, while trading below the pivot point indicates bearish sentiment.
The pivot point is the basis for the indicator, but it also includes other support and resistance levels that are projected based on the pivot point calculation. All these levels help traders see where the price could experience support or resistance. Similarly, if the price moves through these levels it lets the trader know the price is trending in that direction.
When the price of an asset is trading above the pivot point , it indicates the day is bullish or positive.
When the price of an asset is trading below the pivot point , it indicates the day is bearish or negative.
The indicator typically includes four additional levels: S1, S2, R1, and R2. These stand for support one and two, and resistance one and two.
Support and resistance one and two may cause reversals, but they may also be used to confirm the trend. For example, if the price is falling and moves below S1, it helps confirm the downtrend and indicate a possible continuation to S2.
This Script includes the Mid Pivot Points , All levels are based on Fibonacci
僅限邀請腳本
僅作者批准的使用者才能訪問此腳本。您需要申請並獲得使用許可,通常需在付款後才能取得。更多詳情,請依照作者以下的指示操作,或直接聯絡DarkSideTrader。
TradingView不建議在未完全信任作者並了解其運作方式的情況下購買或使用腳本。您也可以在我們的社群腳本中找到免費的開源替代方案。
作者的說明
Follow us
Twitter twitter.com/darksidetrader
YouTube youtube.com/channel/UCAR8aMbticG9ePJrxeZ8mjw
Join Chat Room discord.gg/N4HSqJN96X
Website tradersofwallst.com
Live
9:00 AM EST to 2:30 PM EST
Twitter twitter.com/darksidetrader
YouTube youtube.com/channel/UCAR8aMbticG9ePJrxeZ8mjw
Join Chat Room discord.gg/N4HSqJN96X
Website tradersofwallst.com
Live
9:00 AM EST to 2:30 PM EST
免責聲明
這些資訊和出版物並非旨在提供,也不構成TradingView提供或認可的任何形式的財務、投資、交易或其他類型的建議或推薦。請閱讀使用條款以了解更多資訊。