MichaelWithersOne

Mikes 5 min HHLL Spotter

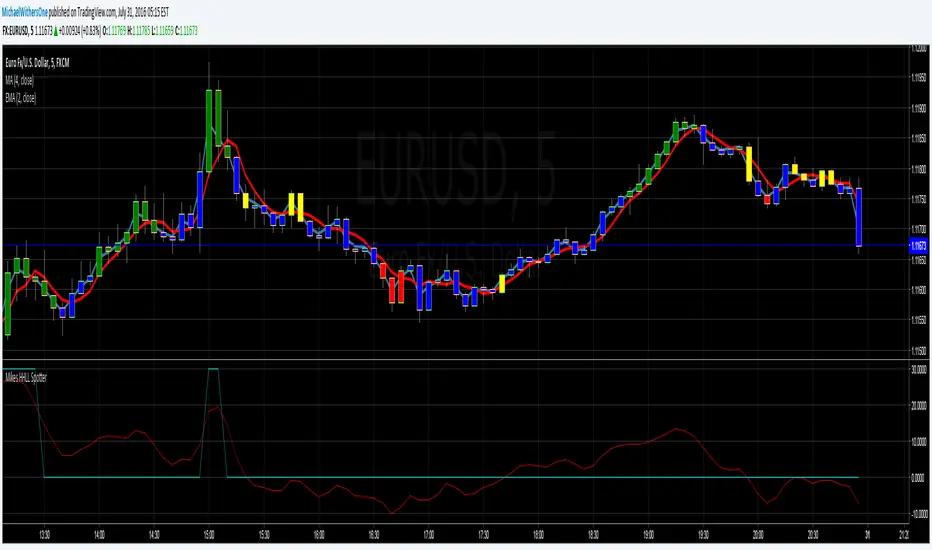
Attempts to find higher highs and lower lows in the 5 minute window. When the light blue graph line peaks , you should investigate selling , when the light blue graph line dips you should investigate buying.

This is good for identifying oversold and over bought positions
開源腳本

本著真正的TradingView精神,該腳本的作者將其開源發布,以便交易者可以理解和驗證它。為作者喝彩吧!您可以免費使用它,但在出版物中重複使用此代碼受網站規則的約束。 您可以收藏它以在圖表上使用。

免責聲明

這些資訊和出版物並不意味著也不構成TradingView提供或認可的金融、投資、交易或其他類型的意見或建議。請在使用條款閱讀更多資訊。

想在圖表上使用此腳本?
//@version=2
study("Mikes HHLL Spotter")
fastMA = ema(close, 3)
slowMA = sma(close, 5)


fastMA2 = ema(close, 2)
slowMA2 = sma(close, 4)

//diff = (fastMA - slowMA)  * 80000
diff = (fastMA2 - slowMA2)  * 80000

smoother = ema(diff,12)
plot(smoother, color=red)

//double EMA shit
xEMA1 = sma(diff, 12)
xEMA2 = sma(xEMA1, 12)
xEMA3 = sma(xEMA2, 12)
nRes = 3 * xEMA1 - 3 * xEMA2 + xEMA3

//plot(nRes, color=yellow)


//buysell =  (smoother < -7 ? -10 : smoother > 9 ? 10 : (smoother < 1 and smoother > -1) ? 10 :   0)

buy = -30
sell = 30
marketFlat = 0

buysell =  (diff < -30 ? buy : diff > 30 ? sell : marketFlat)

smoothbuysell =  (smoother < -15 ? buy : smoother > 15 ? sell : marketFlat)
smootherbuysell =  (nRes < -17 ? buy : nRes > 17 ? sell : marketFlat)

//plot(buysell, color=green)
plot(smoothbuysell, color=aqua)
barcolor(smoother < -7 ? red : smoother > 9 ? green : (smoother < 1 and smoother > -1) ? yellow :   blue)