OPEN-SOURCE SCRIPT
Price Filter [AstrideUnicorn]
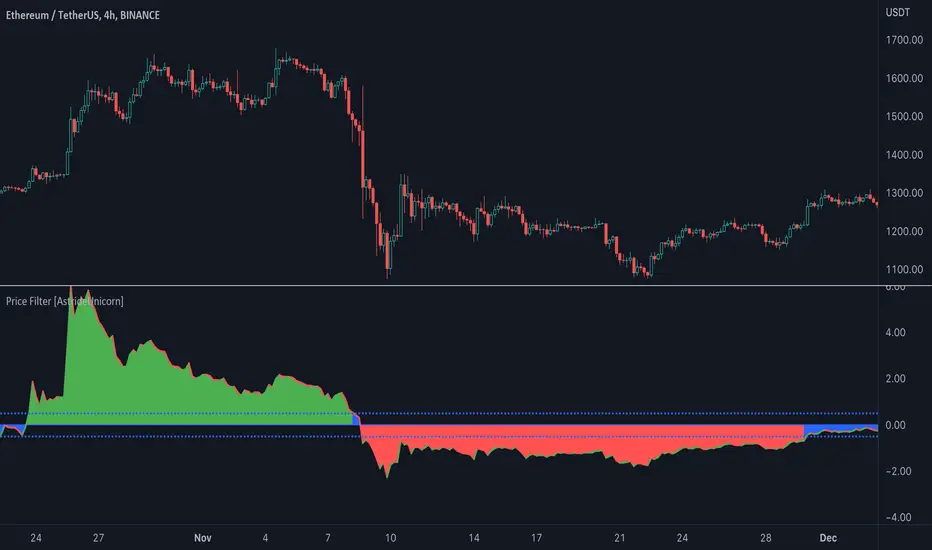
The indicator calculates a fast price filter based on the closing price of the underlying asset. Overall, it is intended to provide a fast, reliable way to detect trend direction and confirm trend strength, using statistical measures of price movements.
The algorithm was adapted from Marcus Schmidberger's (2018) article "High Frequency Trading with the MSCI World ETF". It demeans the price time series using the long-term average and then normalizes it with the long-term standard deviation. The resulting time series is then compared to specified thresholds to determine the trend direction.
HOW TO USE
The indicator surface is colored green if the price is trending upwards and red if the price is trending downwards. If the indicator outline is the opposite color of the indicator surface, it indicates that the price is moving against the trend and the current trend may be losing strength.
If the 'Use threshold' setting is enabled, the indicator will be colored blue if its value is within the range defined by the upper and lower thresholds. This indicates that the price is trending sideways, or that the current trend is losing strength.
SETTNGS
Length - the length of the long-term average used to calculate the price filter. Recommended range 20 - 200. The sensitivity of the indicator increases as the value becomes smaller, allowing it to detect smaller price moves and swings earlier.
Threshold- the threshold value used to detect trend direction.
Use threshold - a boolean (true/false) input that determines whether to use the threshold value for confirmation.
開源腳本
本著TradingView的真正精神,此腳本的創建者將其開源,以便交易者可以查看和驗證其功能。向作者致敬!雖然您可以免費使用它,但請記住,重新發佈程式碼必須遵守我們的網站規則。
Our premium trading indicators: unicorn.trading
Join our Discord community: dsc.gg/unicom
Join our Discord community: dsc.gg/unicom
免責聲明
這些資訊和出版物並不意味著也不構成TradingView提供或認可的金融、投資、交易或其他類型的意見或建議。請在使用條款閱讀更多資訊。
開源腳本
本著TradingView的真正精神,此腳本的創建者將其開源,以便交易者可以查看和驗證其功能。向作者致敬!雖然您可以免費使用它,但請記住,重新發佈程式碼必須遵守我們的網站規則。
Our premium trading indicators: unicorn.trading
Join our Discord community: dsc.gg/unicom
Join our Discord community: dsc.gg/unicom
免責聲明
這些資訊和出版物並不意味著也不構成TradingView提供或認可的金融、投資、交易或其他類型的意見或建議。請在使用條款閱讀更多資訊。