PROTECTED SOURCE SCRIPT
已更新 MarCipher | Buy/sell signals including VWAP, RSI and Stoch RSI.
//Based on many different scripts
The script can be used on every timeframe.
How to use it?
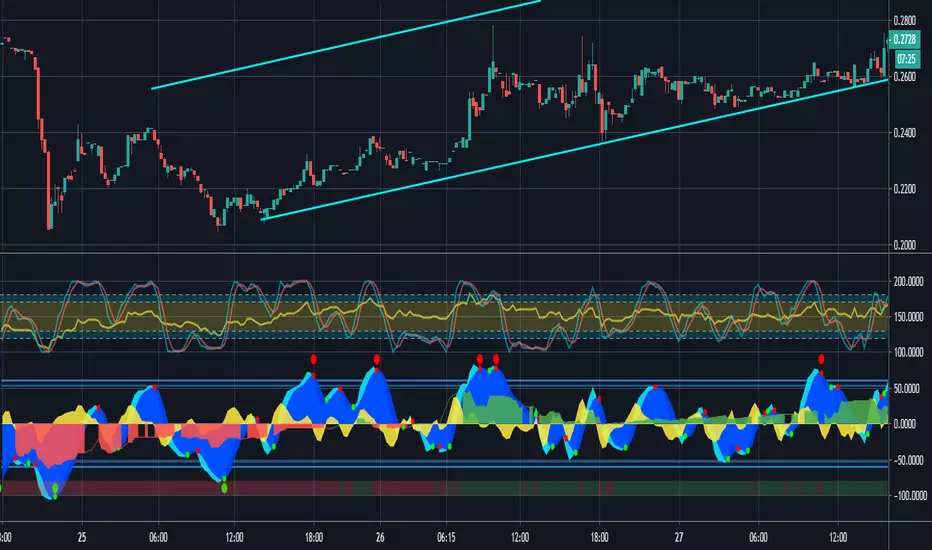
- First check whether the bar (below the waves) is green (which means there is a lot of buying recently), in that case we are looking for a long option. If it is red (ofcourse) we are looking for a short option.
- The green dots below the blue waves represent a buy signal and if the blue wave is oversold (below 60) the green dot is considered a BIG buy signal (more probability of a good trade). The big buy signals are also plotted on the horizontal bar. So a green dot on the bar while the bar is also green represents a buy signal. You can exit the long when a red dot appears in the blue wave above the zero line.
- Another way to use it is to look for divergence of the blue waves. When a blue wave below the zero line appears and then a new wave (some time later) appears which is smaller than the previous, this is considered a good entry point for a long.
- The yellow represents the VWAP (which can be used as a confirmation (crossing up means buying, crossing down means selling)
The RSI is also added (yellow line) oscillating between 100 and 200 (is moved up by 100).
The Stoch RSI is also added (blue and red lines) on the same interval as the RSI.
For improvements, ideas or questions, please don't hesitate to leave a message.
The script can be used on every timeframe.
How to use it?
- First check whether the bar (below the waves) is green (which means there is a lot of buying recently), in that case we are looking for a long option. If it is red (ofcourse) we are looking for a short option.
- The green dots below the blue waves represent a buy signal and if the blue wave is oversold (below 60) the green dot is considered a BIG buy signal (more probability of a good trade). The big buy signals are also plotted on the horizontal bar. So a green dot on the bar while the bar is also green represents a buy signal. You can exit the long when a red dot appears in the blue wave above the zero line.
- Another way to use it is to look for divergence of the blue waves. When a blue wave below the zero line appears and then a new wave (some time later) appears which is smaller than the previous, this is considered a good entry point for a long.
- The yellow represents the VWAP (which can be used as a confirmation (crossing up means buying, crossing down means selling)
The RSI is also added (yellow line) oscillating between 100 and 200 (is moved up by 100).
The Stoch RSI is also added (blue and red lines) on the same interval as the RSI.
For improvements, ideas or questions, please don't hesitate to leave a message.
發行說明
You can now manually create an alert for the big buy signals (big green dots)發行說明
//Updated to Pine Script version 5//Based on many different scripts
The script can be used on every timeframe.
How to use it?
- First check whether the bar (below the waves) is green (which means there is a lot of buying recently), in that case we are looking for a long option. If it is red (ofcourse) we are looking for a short option.
- The green dots below the blue waves represent a buy signal and if the blue wave is oversold (below 60) the green dot is considered a BIG buy signal (more probability of a good trade). The big buy signals are also plotted on the horizontal bar. So a green dot on the bar while the bar is also green represents a buy signal. You can exit the long when a red dot appears in the blue wave above the zero line.
- Another way to use it is to look for divergence of the blue waves. When a blue wave below the zero line appears and then a new wave (some time later) appears which is smaller than the previous, this is considered a good entry point for a long.
- The yellow represents the VWAP (which can be used as a confirmation (crossing up means buying, crossing down means selling)
The RSI is also added (yellow line) oscillating between 100 and 200 (is moved up by 100).
The Stoch RSI is also added (blue and red lines) on the same interval as the RSI.
For improvements, ideas or questions, please don't hesitate to leave a message.
受保護腳本
此腳本以閉源形式發佈。 不過,您可以自由使用,沒有任何限制 — 點擊此處了解更多。
免責聲明
這些資訊和出版物並非旨在提供,也不構成TradingView提供或認可的任何形式的財務、投資、交易或其他類型的建議或推薦。請閱讀使用條款以了解更多資訊。
免責聲明
這些資訊和出版物並非旨在提供,也不構成TradingView提供或認可的任何形式的財務、投資、交易或其他類型的建議或推薦。請閱讀使用條款以了解更多資訊。