OPEN-SOURCE SCRIPT
Regression Channel Trend Detection
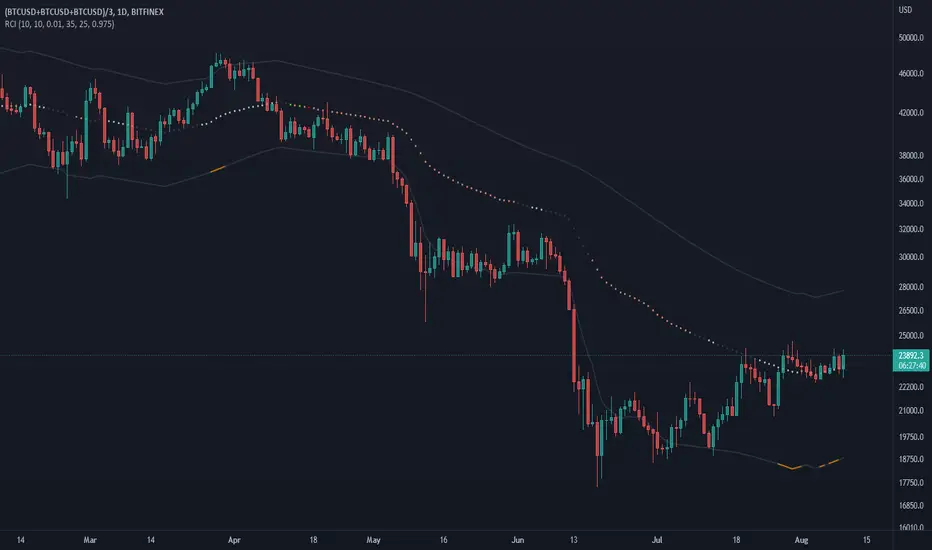
This is a regression channel that uses ichimoku to determine trend. The sensitivity is customizable. The centerline will change color according to the trend detected by ichimoku, and each line can act as support/resistance. The bands of the channel also change colors according to how far price is getting away from them. If you notice in this example, the lower band is turning orange when the price is getting too far away from it, suggesting that it may have risen too fast and too soon. This is still in testing so feel free to comment with any suggestions or fixes.
開源腳本
本著TradingView的真正精神,此腳本的創建者將其開源,以便交易者可以查看和驗證其功能。向作者致敬!雖然您可以免費使用它,但請記住,重新發佈程式碼必須遵守我們的網站規則。
免責聲明
這些資訊和出版物並不意味著也不構成TradingView提供或認可的金融、投資、交易或其他類型的意見或建議。請在使用條款閱讀更多資訊。
免責聲明
這些資訊和出版物並不意味著也不構成TradingView提供或認可的金融、投資、交易或其他類型的意見或建議。請在使用條款閱讀更多資訊。