INVITE-ONLY SCRIPT
Buying/Selling Detector [BruzX]
█ OVERVIEW
This indicator aims to provide a visual and numerical representation of the strength of buying or selling of a security. It does this by calculating and accumulating a bar-by-bar metric and is based on a a conjecture (explained in the Concepts section) about how price and volume reacts to buying and selling behaviour.
█ FEATURES
█ HOW TO USE
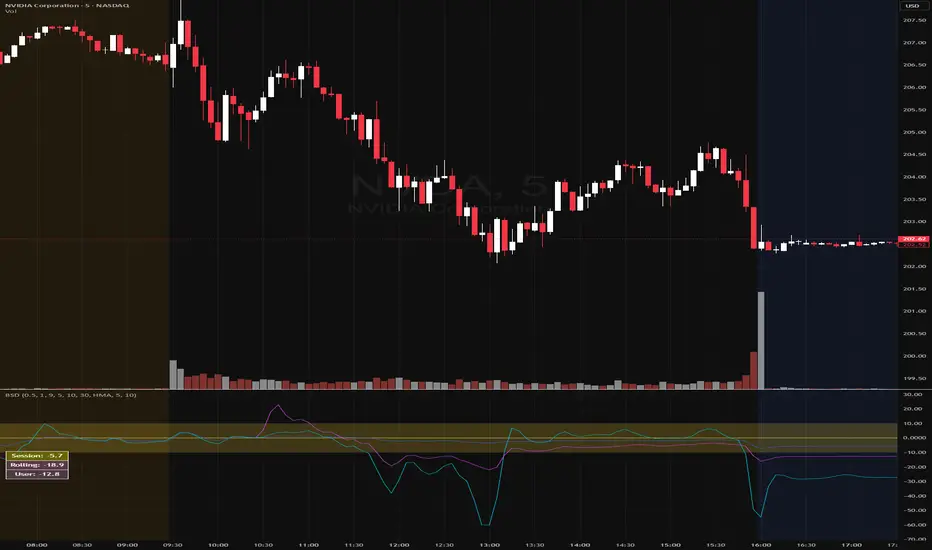
When the indicator is added it appears in a separate pane showing a historical plot of the metric values. If preferred, only the info box can be used as an overlay on the main chart. To do this, disable all the lines in the settings, and move the indicator to the main pane.
There are several options:
One way to use the indicator is to watch for divergences between highs/lows on the indicator compared to high/low on the price, in a similar to how MACD is sometimes used. For example, if the price makes a new high, but this indicator does not, it may indicate a pending reversal.
Another frequent pattern is to watch for spikes, which often indicate an absorption or at least the start of a consolidation (depending on what happens after the spike). Absorption often leads to a reversal, whereas consolidations often continue, e.g. an ABCD or flag pattern.
█ CONCEPTS
There is a conjecture behind the indicator which states that dominant buying or selling can identified by the price and volume behaviour. It is a concept used in Volume Price Analysis, as popularised by the author Anna Coulling. Basically it says that dominant buying, for example, can be identified by rapid upward price movement (compared to the speed of downward movement) on high volume. To create a metric from this concept a non-linear operation (controlled by the Boost option) is used to quantify the strength of the price movement. The effect of volume is then also applied to this metric and a non-linear operation is used for this too (controlled by the Volume factor option).
█ DISCLAIMER
This indicator is provided for information only and should not be used in isolation without considering other factors. You should not take trades using real money based solely on what this indicator says. Any trades you take are entirely at your own risk.
This indicator aims to provide a visual and numerical representation of the strength of buying or selling of a security. It does this by calculating and accumulating a bar-by-bar metric and is based on a a conjecture (explained in the Concepts section) about how price and volume reacts to buying and selling behaviour.
█ FEATURES
- Shows strength of buying/selling (on a scale between -100 to +100, before smoothing) on a separate plot and on the info box
- Shows the metric on three different timescales: since the session open, since a user defined start time and using a rolling relative moving average over the last bars.
- The info box has a background colour corresponding to the strength of buying/selling
█ HOW TO USE
When the indicator is added it appears in a separate pane showing a historical plot of the metric values. If preferred, only the info box can be used as an overlay on the main chart. To do this, disable all the lines in the settings, and move the indicator to the main pane.
There are several options:
- Boost: This controls the strength of a non-linear operation applied to price bars.
- Volume factor: This controls to what extent the volume influences the the metric.
- Rolling RMA length (bars): This controls the number of bars used for the rolling relative moving average metric.
- Scaling factor RMA length (days): This controls the metric scaling so that it remains within -100 and +100 (note: some visual smoothing methods, notable HMA, can cause spikes outside this range). It specifies the number of days back to use to calculating a "usual" metric value for current bar.
- User Start Time: This controls the start time for accumulating the user metric. Default is 10:30, which is the end of the initial balance. Another interesting start time could be, for example, 09:31 to exclude MOO price action and volume.
- Smoothing: Purely visual smoothing to prevent rapid swings.
- Neutral band: Controls the width of the visual neutral level (coloured yellow by default, user can change this), where the values of the metric are considered insignificant. Default is 10, meaning metric values between -10 and +10 will be yellow.
One way to use the indicator is to watch for divergences between highs/lows on the indicator compared to high/low on the price, in a similar to how MACD is sometimes used. For example, if the price makes a new high, but this indicator does not, it may indicate a pending reversal.
Another frequent pattern is to watch for spikes, which often indicate an absorption or at least the start of a consolidation (depending on what happens after the spike). Absorption often leads to a reversal, whereas consolidations often continue, e.g. an ABCD or flag pattern.
█ CONCEPTS
There is a conjecture behind the indicator which states that dominant buying or selling can identified by the price and volume behaviour. It is a concept used in Volume Price Analysis, as popularised by the author Anna Coulling. Basically it says that dominant buying, for example, can be identified by rapid upward price movement (compared to the speed of downward movement) on high volume. To create a metric from this concept a non-linear operation (controlled by the Boost option) is used to quantify the strength of the price movement. The effect of volume is then also applied to this metric and a non-linear operation is used for this too (controlled by the Volume factor option).
█ DISCLAIMER
This indicator is provided for information only and should not be used in isolation without considering other factors. You should not take trades using real money based solely on what this indicator says. Any trades you take are entirely at your own risk.
僅限邀請腳本
只有經作者批准的使用者才能訪問此腳本。您需要申請並獲得使用權限。該權限通常在付款後授予。如欲了解更多詳情,請依照以下作者的說明操作,或直接聯絡BruzX。
除非您完全信任其作者並了解腳本的工作原理,否則TradingView不建議您付費或使用腳本。您也可以在我們的社群腳本中找到免費的開源替代方案。
作者的說明
For access to a suite of indicators which includes this one, please visit: https://www.launchpass.com/pivotmasters/accessplus. If you have any questions, contact me via chat.
If you like my free indicators, please consider my paid ones also: launchpass.com/pivotmasters/accessplus
免責聲明
這些資訊和出版物並不意味著也不構成TradingView提供或認可的金融、投資、交易或其他類型的意見或建議。請在使用條款閱讀更多資訊。