INVITE-ONLY SCRIPT
Aggregated VWAP by Vibie

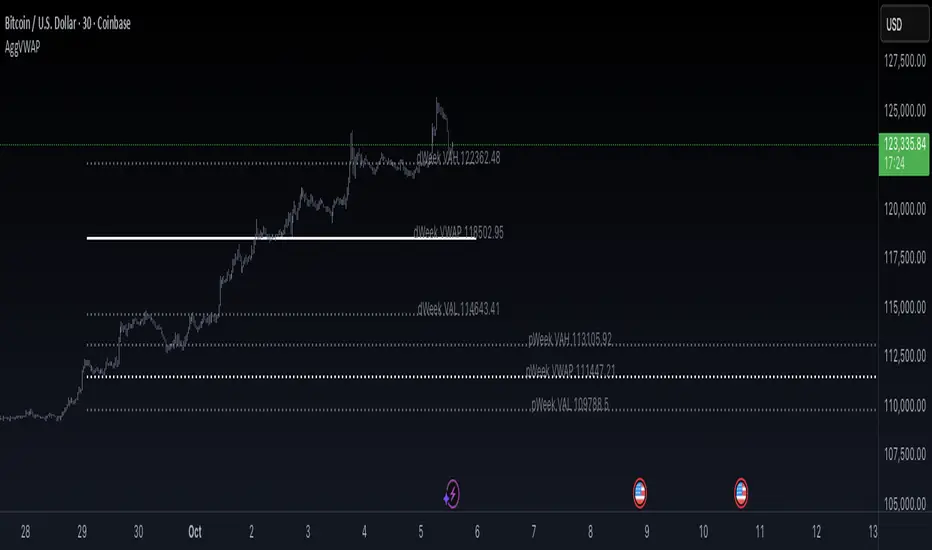
Aggregated VWAP (Professional Layout)
🧠 Concept
VWAP (Volume Weighted Average Price) is a widely used institutional benchmark for fair price.
This indicator enhances standard VWAP by aggregating multiple exchanges, adding standard deviation bands, and offering two visualization modes (bands or lines), providing a professional-grade VWAP analysis tool.
⸻
⚙️ How It Works
1. VWAP Calculation
• VWAP = Σ(price × volume) ÷ Σ(volume), using hlc3 as price reference.
• The indicator supports multiple anchor periods: Daily, Weekly, Monthly, Quarterly, and Yearly.
2. Exchange Aggregation
• VWAP values are aggregated from Binance, Bybit, and Coinbase to compute a market-wide VWAP.
• This prevents bias from a single exchange.
3. Standard Deviation Bands
• Plots ±1σ, ±2σ, ±3σ, ±4σ bands around VWAP.
• These show statistical extremes relative to fair value and act as dynamic overbought/oversold zones.
4. Display Modes
• Bands Mode → continuous VWAP and deviation bands.
• Lines Mode → plots VWAP and deviation levels as fixed horizontal lines for each completed period (e.g., pWeek VAL, dMonth VWAP).
⸻
🧭 How to Use
• VWAP levels act as dynamic support/resistance.
• Deviation bands highlight statistically stretched price areas.
• Previous period VWAP levels (e.g., pWeek, pMonth) often act as institutional reference points.
• Ideal for both swing and intraday trading strategies.
⸻
🌟 Why It’s Original and Useful
• Uses aggregated data for more reliable VWAP calculations.
• Integrates standard deviations, period anchoring, and labeling into one tool.
• Professional layout mirrors institutional analysis techniques.
• Extremely versatile for trend following, mean reversion, and breakout systems.
僅限邀請腳本
僅作者批准的使用者才能訪問此腳本。您需要申請並獲得使用許可,通常需在付款後才能取得。更多詳情,請依照作者以下的指示操作,或直接聯絡ivek。
TradingView不建議在未完全信任作者並了解其運作方式的情況下購買或使用腳本。您也可以在我們的社群腳本中找到免費的開源替代方案。
作者的說明
Access to this script is restricted.
To get access, please follow these steps:
1. Go to my TradingView profile.
2. Click the “Send message” button.
3. Write a short message requesting access to this specific script (include the script name).
4. Access
免責聲明
這些資訊和出版物並非旨在提供,也不構成TradingView提供或認可的任何形式的財務、投資、交易或其他類型的建議或推薦。請閱讀使用條款以了解更多資訊。