OPEN-SOURCE SCRIPT
Dynamic Levels Breakouts [Angel Algo]
INTRODUCTION
The Dynamic Levels Breakouts indicator is a powerful tool designed to identify dynamic support and resistance levels in the price action. It plots these levels on the chart and provides visual signals for bullish and bearish breakouts.
FEATURES
1. Dynamic Support and Resistance Levels.
The indicator calculates the maximum (resistance) and minimum (support) price levels within the defined rolling window. The highest high and lowest low are used to identify dynamic resistance and support levels, respectively.
2. Coloring Conditions
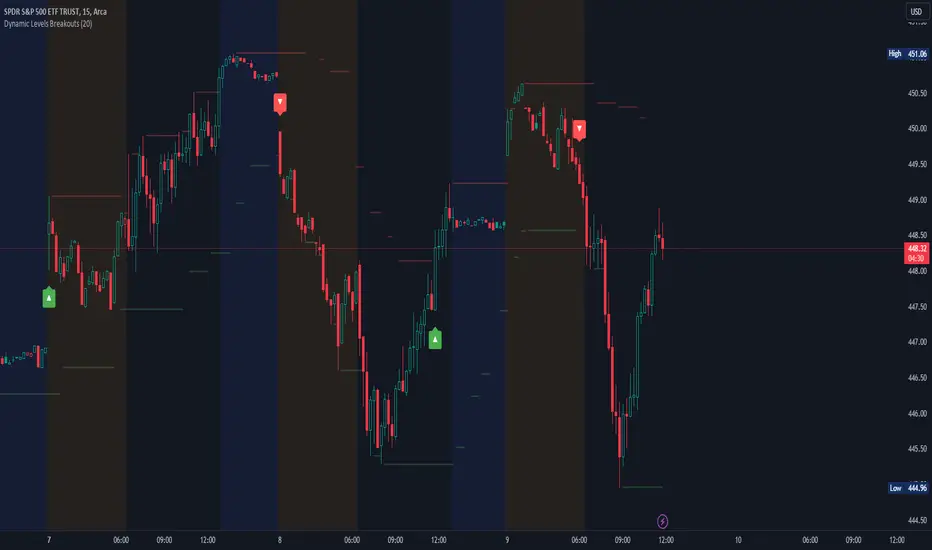
The indicator uses conditional coloring to highlight potential support and resistance levels. When a significant level is detected, it will be colored with a transparent overlay. Red color indicates potential resistance (max_level), and green color indicates potential support (min_level).
3. Bullish and Bearish Breakouts
The indicator also identifies potential bullish and bearish breakouts from the dynamic levels. A bullish breakout occurs when the closing price crosses above the dynamic resistance level (max_level). A bearish breakout occurs when the closing price crosses below the dynamic support level (min_level). The breakout signals are marked with arrow symbols (▲ for bullish and ▼ for bearish) below and above the respective bars.
4. Market Regime
To prevent multiple signals within a short period, the indicator considers the current market regime. If a bullish breakout has occurred recently, it will not generate a new bullish signal until a bearish breakout occurs, and vice versa.
HOW TO USE
The Dynamic Levels Breakouts indicator can be used to identify potential breakout trading opportunities. A bullish breakout signal (▲) suggests a potential long entry or an increase in buying pressure. A bearish breakout signal (▼) indicates a potential short entry or an increase in selling pressure. Traders can use these signals as a reference and combine them with other technical analysis tools and strategies for confirmation.
SETTINGS
Period (length): The user can adjust the "Period" input to define the rolling window for calculating the maximum and minimum price levels. The default value is 20, but it can be set anywhere between 2 and 30. A higher value may yield more significant levels but can also result in delayed signals
The Dynamic Levels Breakouts indicator is a powerful tool designed to identify dynamic support and resistance levels in the price action. It plots these levels on the chart and provides visual signals for bullish and bearish breakouts.
FEATURES
1. Dynamic Support and Resistance Levels.
The indicator calculates the maximum (resistance) and minimum (support) price levels within the defined rolling window. The highest high and lowest low are used to identify dynamic resistance and support levels, respectively.
2. Coloring Conditions
The indicator uses conditional coloring to highlight potential support and resistance levels. When a significant level is detected, it will be colored with a transparent overlay. Red color indicates potential resistance (max_level), and green color indicates potential support (min_level).
3. Bullish and Bearish Breakouts
The indicator also identifies potential bullish and bearish breakouts from the dynamic levels. A bullish breakout occurs when the closing price crosses above the dynamic resistance level (max_level). A bearish breakout occurs when the closing price crosses below the dynamic support level (min_level). The breakout signals are marked with arrow symbols (▲ for bullish and ▼ for bearish) below and above the respective bars.
4. Market Regime
To prevent multiple signals within a short period, the indicator considers the current market regime. If a bullish breakout has occurred recently, it will not generate a new bullish signal until a bearish breakout occurs, and vice versa.
HOW TO USE
The Dynamic Levels Breakouts indicator can be used to identify potential breakout trading opportunities. A bullish breakout signal (▲) suggests a potential long entry or an increase in buying pressure. A bearish breakout signal (▼) indicates a potential short entry or an increase in selling pressure. Traders can use these signals as a reference and combine them with other technical analysis tools and strategies for confirmation.
SETTINGS
Period (length): The user can adjust the "Period" input to define the rolling window for calculating the maximum and minimum price levels. The default value is 20, but it can be set anywhere between 2 and 30. A higher value may yield more significant levels but can also result in delayed signals
開源腳本
秉持TradingView一貫精神,這個腳本的創作者將其設為開源,以便交易者檢視並驗證其功能。向作者致敬!您可以免費使用此腳本,但請注意,重新發佈代碼需遵守我們的社群規範。
Access our exclusive tools at: angelalgo.com
Join our community via discord.gg/FGUTfkmYbW
All content from AngelAlgo is for informational and educational purposes only. Please note that past performance does not guarantee future results.
Join our community via discord.gg/FGUTfkmYbW
All content from AngelAlgo is for informational and educational purposes only. Please note that past performance does not guarantee future results.
免責聲明
這些資訊和出版物並非旨在提供,也不構成TradingView提供或認可的任何形式的財務、投資、交易或其他類型的建議或推薦。請閱讀使用條款以了解更多資訊。