PROTECTED SOURCE SCRIPT
Flow
Hello, everyone,
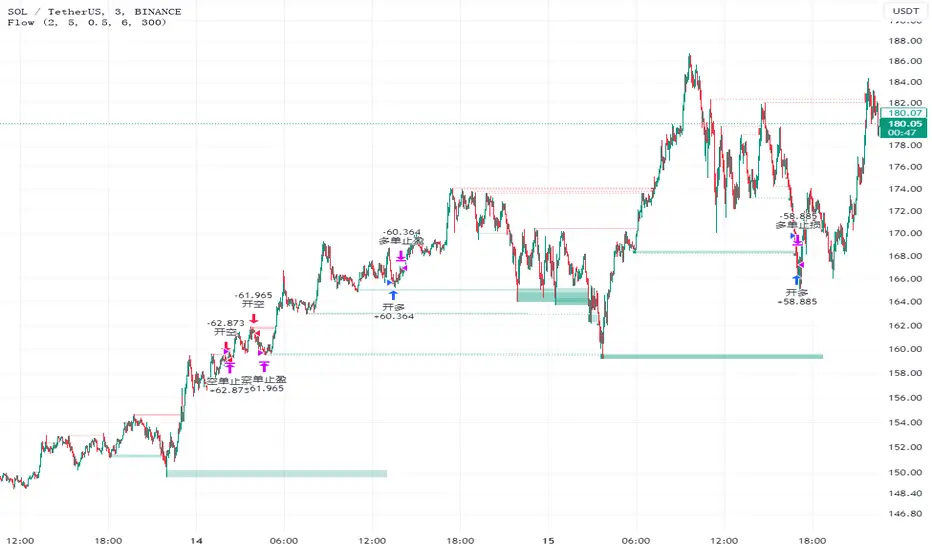
Recently I found a useful indicator for the short-term minute-level trading called Liquidity Sweeps. This is a technical indicator that studies the resistance and support levels of candle patterns.
The strategy takes into account the following market factors:
Lql -> resistance formed by a rapid rise or support formed by a rapid rise
Sweep Area -> potential entry point
The inspiration of this strategy comes mostly from Liquidity Sweeps (LuxAlgo), but I have also optimized it based on my own trading experience.
What are the differences from the original strategy?
The Only Outbreaks & Retest option has been removed, and the formation of Wicks is enough to prevent conflicting signals.
The P&L ratio of the strategy has been set, which allows more combinations of the appropriate strategy parameters to match different characteristics of trading pairs.
Signals
1. Enter the trade when three consecutive bars are formed in the Wicks block (resistance or support) and set the stop-loss/stop-profit
2. The condition is not met when three bars are formed in the Wicks block, and the Wicks index is reset when the price returns.
Risk Management
1. Use the P&L ratio, plus appropriate ATR volatility to prevent false breakouts.
2. When the signal is reversed.
3. The strategy is suitable for the short-term level, not for the trend market.
Now, for the inexperienced reader, a series of knowledge. ATR: Like Boolean channel and ADX, Average True Rage is an indicator used to measure price volatility. But unlike these two indicators, it can reflect the price volatility more accurately because of the factors such as gaps added in its calculation process. For this reason, it is called "true" volatility.
Sincerely,
Special thanks to LuxAlgo for sharing.
受保護腳本
此腳本以閉源形式發佈。 不過,您可以自由使用,沒有任何限制 — 點擊此處了解更多。
免責聲明
這些資訊和出版物並非旨在提供,也不構成TradingView提供或認可的任何形式的財務、投資、交易或其他類型的建議或推薦。請閱讀使用條款以了解更多資訊。
受保護腳本
此腳本以閉源形式發佈。 不過,您可以自由使用,沒有任何限制 — 點擊此處了解更多。
免責聲明
這些資訊和出版物並非旨在提供,也不構成TradingView提供或認可的任何形式的財務、投資、交易或其他類型的建議或推薦。請閱讀使用條款以了解更多資訊。