OPEN-SOURCE SCRIPT
Ninja Trend v2
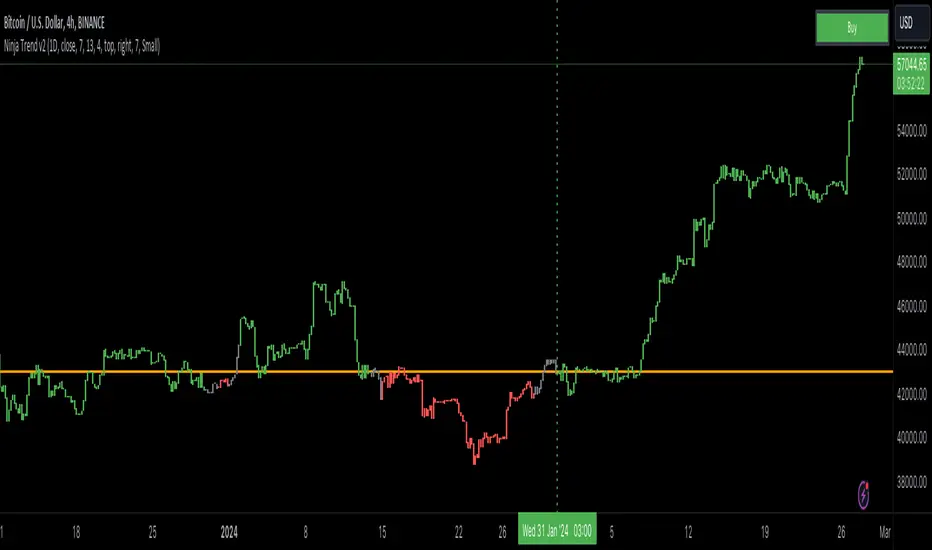
Ninja Trend V2 is best for swing, day trading and scalping using higher timeframe bias and executing in the lower timeframes. Uses MACD for the overall bias and paints a Heikin-Ashi chart.
Settings:
Firstly, go to chart settings, check (tick) the body, uncheck borders and wicks.
Secondly, go to the script settings and input the following;
Source close
Fast moving average 7
Slow moving average 13
Signal length 4
For day trading and scalping, change the script settings timeframe to 15 minutes and use a smaller chart timeframe (M5 or M1)
For swinging change the script settings timeframe to Daily and use H4 chart timeframe.
Behind the code:
When the higher timeframe MACD histogram crosses and closes above zero line, script goes to neutral and paints grey bars waiting for the signal line to cross and close above the zero line and then paints green bars and a buy signal is generated.
When the higher timeframe MACD histogram crosses and closes below zero line, script goes to neutral and paints grey bars waiting for the signal line to cross and close below the zero line and then paints red bars.
Advantage of this is to filter out the chart noise by painting Heikin Ashi charts.
Signals:
Grey means neutral. No entries should be made.
Red means sells only. And then hold until the trend changes to green or use your desired TP and SL.
Green means buys only. And then hold until the trend changes to red or use your desired TP and SL.
開源腳本
秉持TradingView一貫精神,這個腳本的創作者將其設為開源,以便交易者檢視並驗證其功能。向作者致敬!您可以免費使用此腳本,但請注意,重新發佈代碼需遵守我們的社群規範。
免責聲明
這些資訊和出版物並非旨在提供,也不構成TradingView提供或認可的任何形式的財務、投資、交易或其他類型的建議或推薦。請閱讀使用條款以了解更多資訊。
開源腳本
秉持TradingView一貫精神,這個腳本的創作者將其設為開源,以便交易者檢視並驗證其功能。向作者致敬!您可以免費使用此腳本,但請注意,重新發佈代碼需遵守我們的社群規範。
免責聲明
這些資訊和出版物並非旨在提供,也不構成TradingView提供或認可的任何形式的財務、投資、交易或其他類型的建議或推薦。請閱讀使用條款以了解更多資訊。