PROTECTED SOURCE SCRIPT
Candles, average accumulation CTE
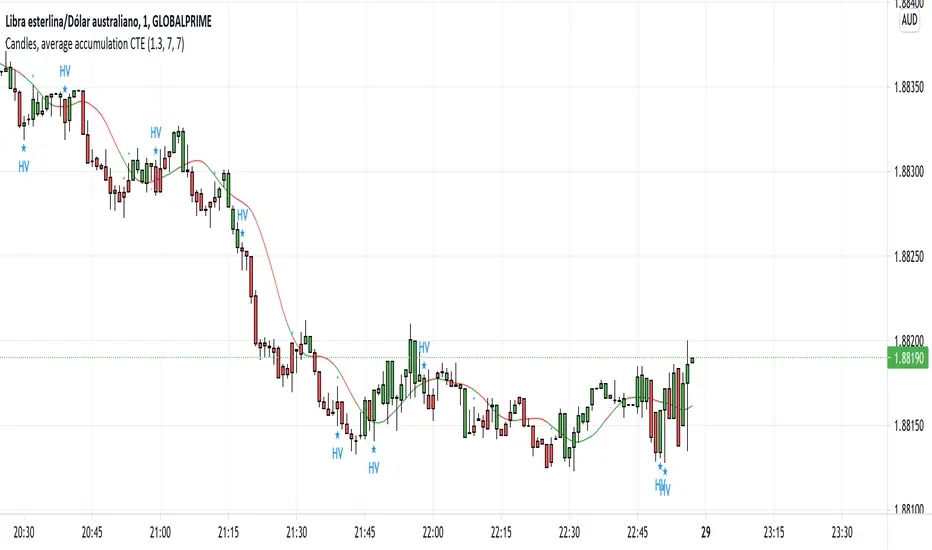
Hello everyone, this indicator is made to calculate the historical average cumulative volume, in the number configurable by the trader.
It is used to display bullish or bearish color in relation to the accumulation of historical volumes.
In the settings of the same indicator you can read the recommendations.
This indicator has 4 relevant data
1- Average accumulated volume, configurable by color
2- It shows us the climatic volume, based on the considerable and configurable increase in volume, in relation to the volume of the nearby candles.
3- It shows us a smoothed moving average, acting as support or dynamic resistance, this moving average should be used as a complement for the volume analysis, for example, if the color of the last candle appears in a negative accumulation color then we must wait that has force in movement with the crossing of the moving average.
In addition, this moving average is being used to perform anticipation calculations, based on short-term average accumulations of volume.
4- Anticipation calculations, the indicator shows us signs of "+" or "-" if the result of the early accumulation is being supported by climatic volume and in the same direction as the candle.
I hope this indicator is very useful so that you can keep in mind a relevant data such as the volume and the ease of visualization in space and time of the graph.
受保護腳本
此腳本以閉源形式發佈。 不過,您可以自由使用,沒有任何限制 — 點擊此處了解更多。
免責聲明
這些資訊和出版物並非旨在提供,也不構成TradingView提供或認可的任何形式的財務、投資、交易或其他類型的建議或推薦。請閱讀使用條款以了解更多資訊。
受保護腳本
此腳本以閉源形式發佈。 不過,您可以自由使用,沒有任何限制 — 點擊此處了解更多。
免責聲明
這些資訊和出版物並非旨在提供,也不構成TradingView提供或認可的任何形式的財務、投資、交易或其他類型的建議或推薦。請閱讀使用條款以了解更多資訊。