PROTECTED SOURCE SCRIPT
已更新 Kitaec MADIV (MAp of DIVergences)
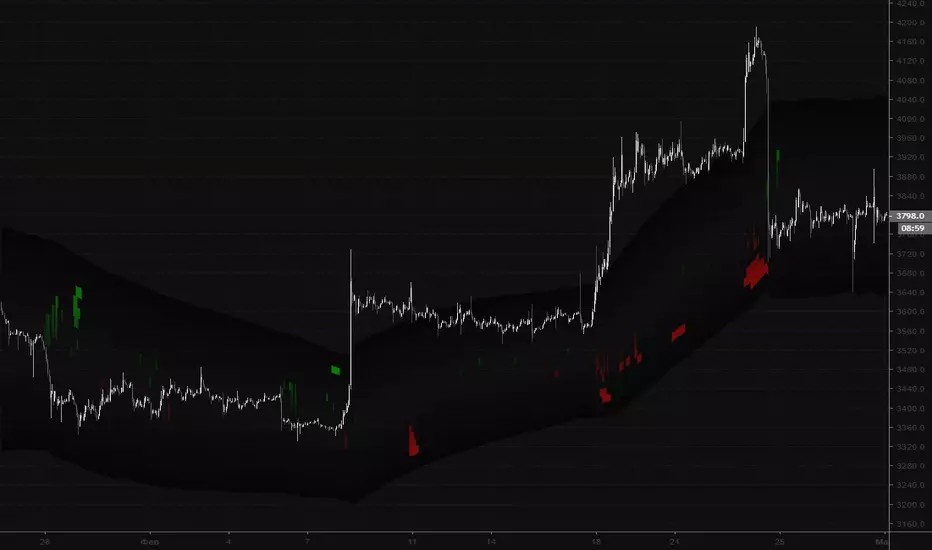
Map of RSI divergences part one. Must be used with MADIV2 (its a part 2 of this script). Showing Bullish and bearish divergences from different timeframes on the chart. Timeframes for full script are: 5m-15m-30m-1h-2h-4h-6h-8h-12h-1d. This part is from 5m to 2h. Second part is 4h-1d.
發行說明
Map of RSI divergencies for 5m to 1D timeframes shown in a form of map. Updated to the PineScript v6.受保護腳本
此腳本以閉源形式發佈。 However, you can use it freely and without any limitations – learn more here.
免責聲明
The information and publications are not meant to be, and do not constitute, financial, investment, trading, or other types of advice or recommendations supplied or endorsed by TradingView. Read more in the Terms of Use.
受保護腳本
此腳本以閉源形式發佈。 However, you can use it freely and without any limitations – learn more here.
免責聲明
The information and publications are not meant to be, and do not constitute, financial, investment, trading, or other types of advice or recommendations supplied or endorsed by TradingView. Read more in the Terms of Use.