PROTECTED SOURCE SCRIPT
已更新 GreyPool VSA Spread/Wick Divergence Indicator
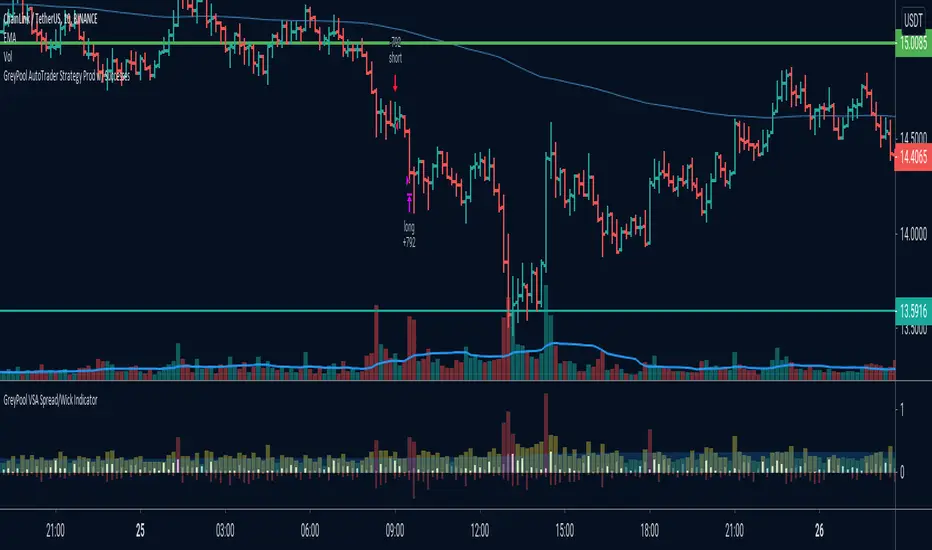
The purpose of this indicator is to determine the distance between the spread of a bar/candle and the wick at a glance (Spread is defined as the range between the open and close and the wick is any part of the bar/candle that is beyond that range).
Climactic action bars typically have large spreads and a pronounced wick which indicates hidden buying or selling.
Definitions of Colors:
Light Blue Area - Average spread size of the last x bars where x is the set MA period
Red Column - Indicates a very high spread that is far beyond the average
Yellow Column - Indicates spreads that are at the average line or just above it
Green Column - Indicates a very low spread
Thin Red Histogram - Indicates the size of the bottom wick (Either the distance between the close and low of down bars or the open and low or up bars)
Thin Blue Histogram - Indicates the size of the top wick (Either the distance between the open and high for down bars or the close and high for up bars)
*** Please Click The LIKE Button to Support Us, Thank You ***
發行說明
Changed "Thin Blue Histogram" line to whiteUsage:
More or less like a spread Delta, there is the possibility of looking at "trending" spread changes. For example, if the last 50 bars shows up bars with longer wicks and spreads and down bars with shorter wicks and smaller spreads it could be deduced that there is less resistance to the down side
發行說明
Added the ability to switch between the spread calculated as the difference between high and low or the difference between close and open發行說明
Changed default Spread option to H-L受保護腳本
此腳本以閉源形式發佈。 不過,您可以自由使用,沒有任何限制 — 點擊此處了解更多。
GreyPool.io
Try our automated trading strategies at: greypool.io
Try our automated trading strategies at: greypool.io
免責聲明
這些資訊和出版物並非旨在提供,也不構成TradingView提供或認可的任何形式的財務、投資、交易或其他類型的建議或推薦。請閱讀使用條款以了解更多資訊。
受保護腳本
此腳本以閉源形式發佈。 不過,您可以自由使用,沒有任何限制 — 點擊此處了解更多。
GreyPool.io
Try our automated trading strategies at: greypool.io
Try our automated trading strategies at: greypool.io
免責聲明
這些資訊和出版物並非旨在提供,也不構成TradingView提供或認可的任何形式的財務、投資、交易或其他類型的建議或推薦。請閱讀使用條款以了解更多資訊。