INVITE-ONLY SCRIPT
已更新 Quantum Shift [MOT]
🔷 Quantum Shift [MOT] — Multi-Timeframe Reversal System with EMA-Based Structure Mapping
Quantum Shift [MOT] is a multi-timeframe trading system designed to help traders identify high-probability reversal zones, breakout continuations, and trend shifts using a combination of real-time signal detection and structural level plotting.
This tool is built for precision execution — especially for traders working on futures markets, indices, and high-frequency assets using 30-second, 1-minute, and 5-minute charts.
Rather than relying on traditional lagging methods, Quantum Shift combines exponential moving averages, volume-triggered reversal candles, and dynamic structure logic to help you interpret market changes with greater clarity and confluence.
________________________________________
🔍 What Does It Do?
Quantum Shift continuously monitors price action and trend pressure across multiple timeframes. When the system detects that the current price behavior has reversed direction and aligns across multiple perspectives, it triggers an actionable visual signal. These signals are plotted on the chart with entry zones, optional stop levels, and color-coded background clouds to represent broader trend flow.
________________________________________
🧠 Core Features & How They Work
________________________________________
✅ 1. Multi-Timeframe Reversal Signals
At the heart of the script is a custom-built engine that detects momentum reversals using:
This triple-confirmation approach filters out low-conviction setups and focuses on structural shifts that are likely to result in a directional move.

📸 Image: A blue candle signal forming on a 1-minute chart with green background cloud.
________________________________________
✅ 2. EMA-Based Support & Resistance Plotting
When a significant crossover occurs between two exponential moving averages, Quantum Shift automatically plots a horizontal level at the crossover price. These levels are interpreted as dynamic support or resistance zones, based on the direction of the signal.

📸 Image: Dynamic support and resistance lines in action — dashed lines represent 1-minute levels, while solid lines indicate 5-minute levels.
________________________________________
✅ 3. Trend Clouds
Quantum Shift overlays the chart with trend clouds that respond to directional pressure in real time. These zones are calculated using multi-tiered Supertrend logic and provide an at-a-glance way to:

📸 Image: Background fill transitioning from red to green, with signal appearing shortly after.
________________________________________
✅ 4. Volume & Risk Filters
To enhance quality and reduce noise, Quantum Shift includes:
These filters can be toggled and adjusted to suit different strategies and risk profiles.

📸 Image: All possible signal filters in the settings
________________________________________
✅ 5. Smart Entry Labeling & Dynamic Stop Loss
Upon confirmation of a valid reversal signal:

📸 Image: A “Sell” label and dynamic stop plotted above purple reversal candle.
________________________________________
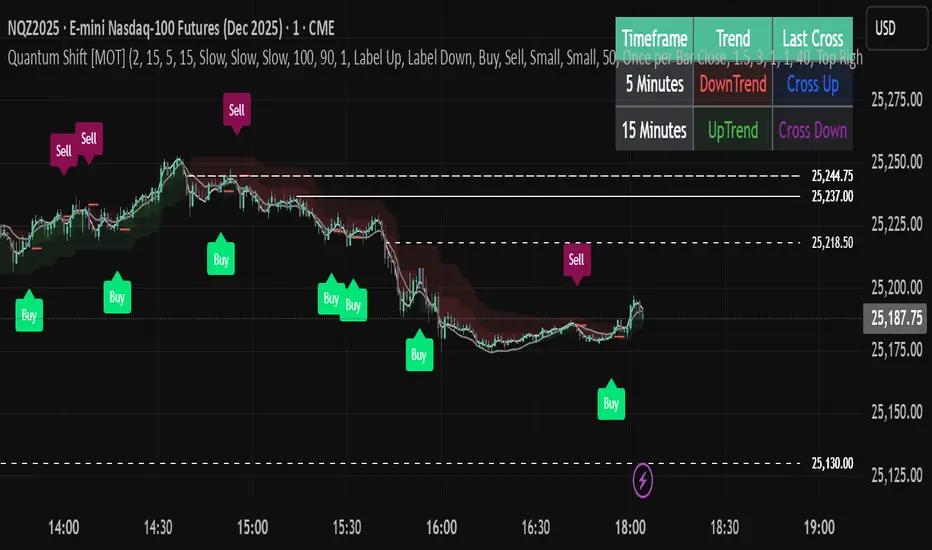
✅ 6. Multi-Timeframe Trend Table
The live dashboard provides a simplified view of trend alignment and recent signals across timeframes:
This allows traders to confirm confluence without switching between charts.

📸 Image: Trend table showing last trend and candle state on HTF and LTF
________________________________________
⚙️ Customizable Settings
Quantum Shift is built with flexibility in mind. You can:
• Toggle between fast or slow trend models per timeframe
• Enable/disable filters for volume, chop, trend alignment, and stop distance
• Choose whether entries occur on the trigger candle or the breakout
• Adjust all visuals including cloud transparency, line widths, label offsets
• Use on both premium and non-premium TradingView accounts
________________________________________
🧩 Designed For:
• Futures scalpers working with NQ, ES, MNQ, RTY, etc.
• Intraday traders who need clarity during volatility spikes
• Traders who want EMA structure + price confirmation + trend confluence
• Anyone seeking a visual, rule-based system for reacting to real-time market behavior
________________________________________
🔔 Alerts Built In
• Reversal trigger detection
• Breakout confirmation
• Multi-timeframe trend shift
• Invalidated stop zones
• Complete entry-ready alert logic
________________________________________
⚠️ Disclaimer
This script is for educational and informational purposes only. It does not provide financial advice, and past performance does not guarantee future results. Trading carries risk, and all decisions are your responsibility. Redistribution or unauthorized use is strictly prohibited.
Quantum Shift [MOT] is a multi-timeframe trading system designed to help traders identify high-probability reversal zones, breakout continuations, and trend shifts using a combination of real-time signal detection and structural level plotting.
This tool is built for precision execution — especially for traders working on futures markets, indices, and high-frequency assets using 30-second, 1-minute, and 5-minute charts.
Rather than relying on traditional lagging methods, Quantum Shift combines exponential moving averages, volume-triggered reversal candles, and dynamic structure logic to help you interpret market changes with greater clarity and confluence.
________________________________________
🔍 What Does It Do?
Quantum Shift continuously monitors price action and trend pressure across multiple timeframes. When the system detects that the current price behavior has reversed direction and aligns across multiple perspectives, it triggers an actionable visual signal. These signals are plotted on the chart with entry zones, optional stop levels, and color-coded background clouds to represent broader trend flow.
________________________________________
🧠 Core Features & How They Work
________________________________________
✅ 1. Multi-Timeframe Reversal Signals
At the heart of the script is a custom-built engine that detects momentum reversals using:
- Reversal candles (Blue for bullish setups, Purple for bearish setups)
- Price relationship to exponential moving averages
- Agreement across multiple timeframes (typically current, lower, and higher)
This triple-confirmation approach filters out low-conviction setups and focuses on structural shifts that are likely to result in a directional move.
📸 Image: A blue candle signal forming on a 1-minute chart with green background cloud.
________________________________________
✅ 2. EMA-Based Support & Resistance Plotting
When a significant crossover occurs between two exponential moving averages, Quantum Shift automatically plots a horizontal level at the crossover price. These levels are interpreted as dynamic support or resistance zones, based on the direction of the signal.
- Bullish EMA crossover → support level is plotted
- Bearish EMA crossover → resistance level is plotted
- These levels appear on 1-minute and 5-minute charts, and remain until they are invalidated by price
- If price breaks back through the level in the opposite direction, it is automatically removed
📸 Image: Dynamic support and resistance lines in action — dashed lines represent 1-minute levels, while solid lines indicate 5-minute levels.
________________________________________
✅ 3. Trend Clouds
Quantum Shift overlays the chart with trend clouds that respond to directional pressure in real time. These zones are calculated using multi-tiered Supertrend logic and provide an at-a-glance way to:
- Confirm broader trend bias
- Avoid entering against strong directional moves
- Visually align entry signals with the current market regime
📸 Image: Background fill transitioning from red to green, with signal appearing shortly after.
________________________________________
✅ 4. Volume & Risk Filters
To enhance quality and reduce noise, Quantum Shift includes:
- Volume spike filtering — signals require above-average volume (configurable)
- Stop range limitation — filters out setups with excessive risk
- Chop zone detection — suppresses signals in sideways markets
These filters can be toggled and adjusted to suit different strategies and risk profiles.
📸 Image: All possible signal filters in the settings
________________________________________
✅ 5. Smart Entry Labeling & Dynamic Stop Loss
Upon confirmation of a valid reversal signal:
- The script plots a Buy or Sell label at the entry candle
- A dynamic stop-loss level is plotted below/above the reversal point
- Alerts can be triggered based on:
- Initial candle formation
- Breakout of the trigger candle
- Confluence of trend filters and volume
📸 Image: A “Sell” label and dynamic stop plotted above purple reversal candle.
________________________________________
✅ 6. Multi-Timeframe Trend Table
The live dashboard provides a simplified view of trend alignment and recent signals across timeframes:
- Lower timeframe trend state
- Higher timeframe trend state
- Last signal candle type
- Timeframe labels for clarity
This allows traders to confirm confluence without switching between charts.
📸 Image: Trend table showing last trend and candle state on HTF and LTF
________________________________________
⚙️ Customizable Settings
Quantum Shift is built with flexibility in mind. You can:
• Toggle between fast or slow trend models per timeframe
• Enable/disable filters for volume, chop, trend alignment, and stop distance
• Choose whether entries occur on the trigger candle or the breakout
• Adjust all visuals including cloud transparency, line widths, label offsets
• Use on both premium and non-premium TradingView accounts
________________________________________
🧩 Designed For:
• Futures scalpers working with NQ, ES, MNQ, RTY, etc.
• Intraday traders who need clarity during volatility spikes
• Traders who want EMA structure + price confirmation + trend confluence
• Anyone seeking a visual, rule-based system for reacting to real-time market behavior
________________________________________
🔔 Alerts Built In
• Reversal trigger detection
• Breakout confirmation
• Multi-timeframe trend shift
• Invalidated stop zones
• Complete entry-ready alert logic
________________________________________
⚠️ Disclaimer
This script is for educational and informational purposes only. It does not provide financial advice, and past performance does not guarantee future results. Trading carries risk, and all decisions are your responsibility. Redistribution or unauthorized use is strictly prohibited.
發行說明
Quantum Shift v1.1 – Visual Customization UpdateThis update brings new visual customization features to enhance chart readability and flexibility:
Custom Candle Colors
You can now change the color of Buy and Sell trigger candles to better match your chart theme.
Adjustable Price Label Size
Select from Tiny, Small, Normal, Large, or Huge for better control over price label visibility.
Custom Stop Loss Line Colors
Choose separate colors for Long and Short stop loss lines for easier trade visualization.
發行說明
Quantum Shift v1.2- Added increased label customization
- Stop Loss lines stop printing after 3 bars to avoid clutter
- Made the default signal settings match Javi's settings
發行說明
Quantum Shift v1.3- Added two timeframe inputs to the Trend Table.
- Replaced “last candle” with "last cross" condition in the table.
- Added a max-distance input to show/hide levels relative to current price.
- 1-minute levels now persist across days.
- Display up to 500 buy/sell labels without Bar Replay.
- Option to show only the most recent buy/sell label for a cleaner chart.
- Lines and labels now extend with price (adjust via Label/Line Offset).
- Cleaner price labels.
發行說明
Release v1.4- Added inputs for S/R lines
- Optimized looping logic to reduce script load
發行說明
Release v1.5- S/R line logic update to resolve random issues
發行說明
Custom input for line lookback僅限邀請腳本
僅作者批准的使用者才能訪問此腳本。您需要申請並獲得使用許可,通常需在付款後才能取得。更多詳情,請依照作者以下的指示操作,或直接聯絡TheBigDaddyMax。
TradingView不建議在未完全信任作者並了解其運作方式的情況下購買或使用腳本。您也可以在我們的社群腳本中找到免費的開源替代方案。
作者的說明
🔒 Access Instructions
Visit https://whop.com/mot-quantum-shift to gain access.
免責聲明
這些資訊和出版物並非旨在提供,也不構成TradingView提供或認可的任何形式的財務、投資、交易或其他類型的建議或推薦。請閱讀使用條款以了解更多資訊。
僅限邀請腳本
僅作者批准的使用者才能訪問此腳本。您需要申請並獲得使用許可,通常需在付款後才能取得。更多詳情,請依照作者以下的指示操作,或直接聯絡TheBigDaddyMax。
TradingView不建議在未完全信任作者並了解其運作方式的情況下購買或使用腳本。您也可以在我們的社群腳本中找到免費的開源替代方案。
作者的說明
🔒 Access Instructions
Visit https://whop.com/mot-quantum-shift to gain access.
免責聲明
這些資訊和出版物並非旨在提供,也不構成TradingView提供或認可的任何形式的財務、投資、交易或其他類型的建議或推薦。請閱讀使用條款以了解更多資訊。