INVITE-ONLY SCRIPT
已更新 FXReaper X4 v1

FXR X4
This indicator is the fourth part of a series of indicators designed to beat the market.
Features
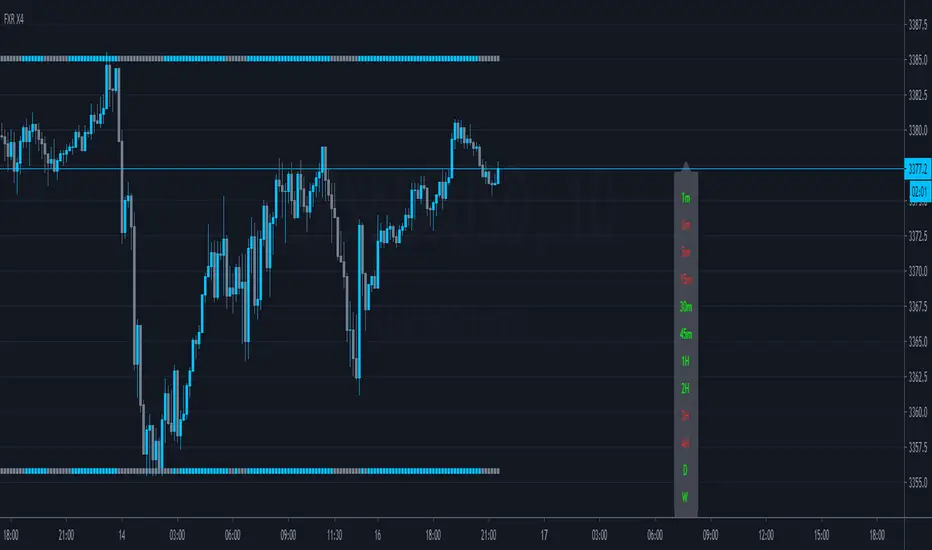
- Confirmation Squares/Bars
- Multi Timeframe Trend (MTT)

 US30USD
How to Use
How to use this indicator depends on you as the trader, how to best utilize this objectively is to apply it as confluence to your analysis.
- Confluence Squares
| This is can be used as a way of a trend bias. When both top and bottom have the same color, then look for buy or sell opportunities in the given direction.
| Top squares are faster at changing than the bottom
- MTT
| MTT is an additional form of current trend analysis. This can be used as a way of trading while following the current trend on whichever timeframe.
| If all are green, then we are fully bullish. Vice-versa, if they are blood red, bearish market.
Disclaimer
This by no means is a guaranteed signal. These should be used as confluence to your own technical/ fundamental analysis.
Do not rely on this solely unless you know what you are doing.
These indicators were pulled and modified from existing indicators and adjusted to our personal preferences.
There are custom inputs for those to adjust to their own liking.
How to Get Access
To get access please send me a private message via TradingView.
This indicator is the fourth part of a series of indicators designed to beat the market.
Features
- Confirmation Squares/Bars
- Multi Timeframe Trend (MTT)
How to Use
How to use this indicator depends on you as the trader, how to best utilize this objectively is to apply it as confluence to your analysis.
- Confluence Squares
| This is can be used as a way of a trend bias. When both top and bottom have the same color, then look for buy or sell opportunities in the given direction.
| Top squares are faster at changing than the bottom
- MTT
| MTT is an additional form of current trend analysis. This can be used as a way of trading while following the current trend on whichever timeframe.
| If all are green, then we are fully bullish. Vice-versa, if they are blood red, bearish market.
Disclaimer
This by no means is a guaranteed signal. These should be used as confluence to your own technical/ fundamental analysis.
Do not rely on this solely unless you know what you are doing.
These indicators were pulled and modified from existing indicators and adjusted to our personal preferences.
There are custom inputs for those to adjust to their own liking.
How to Get Access
To get access please send me a private message via TradingView.
發行說明
{Update}- Fix issues with the timeframe tab not properly matching when switching to different timeframes.
- Cleaned up the code even more, also updated the default color scheme.
僅限邀請腳本
僅作者批准的使用者才能訪問此腳本。您需要申請並獲得使用許可,通常需在付款後才能取得。更多詳情,請依照作者以下的指示操作,或直接聯絡ForexReaper。
TradingView不建議在未完全信任作者並了解其運作方式的情況下購買或使用腳本。您也可以在我們的社群腳本中找到免費的開源替代方案。
作者的說明
免責聲明
這些資訊和出版物並非旨在提供,也不構成TradingView提供或認可的任何形式的財務、投資、交易或其他類型的建議或推薦。請閱讀使用條款以了解更多資訊。
僅限邀請腳本
僅作者批准的使用者才能訪問此腳本。您需要申請並獲得使用許可,通常需在付款後才能取得。更多詳情,請依照作者以下的指示操作,或直接聯絡ForexReaper。
TradingView不建議在未完全信任作者並了解其運作方式的情況下購買或使用腳本。您也可以在我們的社群腳本中找到免費的開源替代方案。
作者的說明
免責聲明
這些資訊和出版物並非旨在提供,也不構成TradingView提供或認可的任何形式的財務、投資、交易或其他類型的建議或推薦。請閱讀使用條款以了解更多資訊。