PROTECTED SOURCE SCRIPT
Dynamic VWAP -WinCAlgo
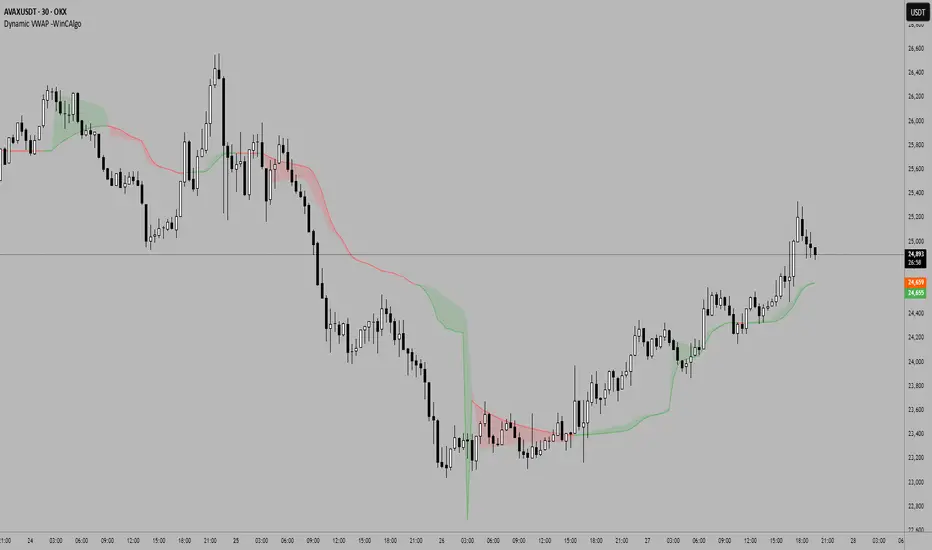
Dynamic VWAP Curve
This indicator applies an adaptive smoothing method to VWAP (Volume Weighted Average Price) to create two dynamic curves:
Fast VWAP (reacts quickly to price changes)
Smoothed VWAP (slower, adaptive baseline)
How to interpret:
When Fast VWAP > Smoothed VWAP, trend bias is bullish.
When Fast VWAP < Smoothed VWAP, trend bias is bearish.
The shaded area between the two lines works like a dynamic support/resistance zone.
📌 Usage ideas:
As a trend filter: take long trades only when Fast > Smoothed.
As a crossover signal: buy/sell when the two lines cross.
As support/resistance: price moving too far from the band can signal mean-reversion opportunities.
受保護腳本
此腳本以閉源形式發佈。 不過,您可以自由使用,沒有任何限制 — 點擊此處了解更多。
免責聲明
這些資訊和出版物並非旨在提供,也不構成TradingView提供或認可的任何形式的財務、投資、交易或其他類型的建議或推薦。請閱讀使用條款以了解更多資訊。
受保護腳本
此腳本以閉源形式發佈。 不過,您可以自由使用,沒有任何限制 — 點擊此處了解更多。
免責聲明
這些資訊和出版物並非旨在提供,也不構成TradingView提供或認可的任何形式的財務、投資、交易或其他類型的建議或推薦。請閱讀使用條款以了解更多資訊。