OPEN-SOURCE SCRIPT
Bitcoin Power Law Model
Bitcoin Power Law Model with Cycle Predictions
Scientific Price Modeling for Bitcoin
This indicator implements **Dr. Giovanni Santostasi's Bitcoin Power Law Theory** - a discovery that Bitcoin's price follows mathematical laws similar to natural phenomena. Unlike traditional financial models, this treats Bitcoin as a scale-invariant system that grows predictably over time.
What Makes This Special
Dr. Santostasi, an astrophysicist who studied gravitational waves, discovered that Bitcoin's price forms a perfect straight line when plotted on a log-log scale over its entire 15-year history. This isn't just another technical indicator - it's a fundamental law that has held true through multiple 80%+ crashes and recoveries.
Core Features
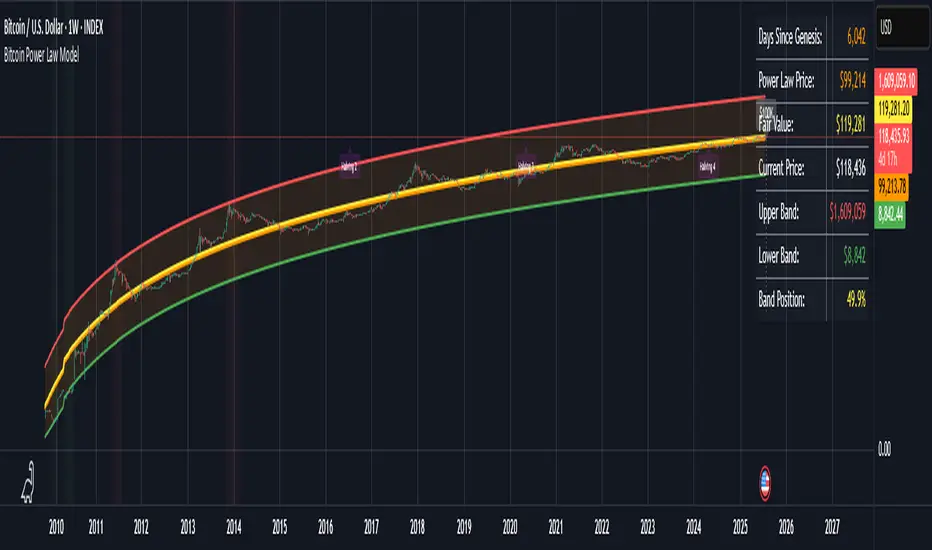
Power Law Model
- Orange Line: The power law trajectory showing Bitcoin's long-term growth path
- Yellow Line: Fair value (geometric mean between support and resistance)
- Green/Red Bands: Support and resistance levels that have historically contained price movements
- Band Position %: Shows exactly where price sits within the power law channel (0-100%)
How to Use It
For Long-term Investors
1. Accumulate when price is near the green support line (band position < 20%)
2. Hold when price is between the bands
3. Consider profits when approaching red resistance (band position > 80%)
4. Never panic - the model shows $30K+ is now the permanent floor
Key Metrics to Watch
- **Band Position: <20% = Oversold, >80% = Overbought
- Fair Value: Price above = Overvalued, below = Undervalued
- Support Line: Breaking below suggests model invalidation
Current Cycle Projections
Based on the November 2022 bottom at ~$15,500:
- Cycle Peak: ~$155,000-$230,000 (October 2025)
- Next Bottom: ~$70,000-$100,000 (October 2026)
- Long-term: $1 million by 2033 (power law projection)
Customizable Settings
Model Parameters
- Intercept & Slope: Fine-tune the power law formula
- Band Offsets: Adjust support/resistance distances
Display Options
- Toggle each visual element on/off
- Show/hide future projections
- Enable/disable cycle analysis
- Customize halving markers
Understanding the Math
The model uses the formula: **Price = 10^(A + B × log10(days since genesis))**
Where:
- A = -17.01 (intercept)
- B = 5.82 (slope)
- Days counted from Bitcoin's genesis block (Jan 3, 2009)
This creates parallel support/resistance lines in log-log space that have contained Bitcoin's price for 15+ years.
Important
1.Not Financial Advice: This is a mathematical model, not a guarantee
2. Long-term Focus: Best suited for macro analysis, not day trading
3. Model Limitations: Past performance doesn't ensure future results
4. Volatility Expected: 50-80% drawdowns are normal within the model
Background
Dr. Giovanni Santostasi discovered this model while analyzing Bitcoin through the lens of physics. He found that Bitcoin behaves more like a city or organism than a financial asset, growing according to universal power laws found throughout
Scientific Price Modeling for Bitcoin
This indicator implements **Dr. Giovanni Santostasi's Bitcoin Power Law Theory** - a discovery that Bitcoin's price follows mathematical laws similar to natural phenomena. Unlike traditional financial models, this treats Bitcoin as a scale-invariant system that grows predictably over time.
What Makes This Special
Dr. Santostasi, an astrophysicist who studied gravitational waves, discovered that Bitcoin's price forms a perfect straight line when plotted on a log-log scale over its entire 15-year history. This isn't just another technical indicator - it's a fundamental law that has held true through multiple 80%+ crashes and recoveries.
Core Features
Power Law Model
- Orange Line: The power law trajectory showing Bitcoin's long-term growth path
- Yellow Line: Fair value (geometric mean between support and resistance)
- Green/Red Bands: Support and resistance levels that have historically contained price movements
- Band Position %: Shows exactly where price sits within the power law channel (0-100%)
How to Use It
For Long-term Investors
1. Accumulate when price is near the green support line (band position < 20%)
2. Hold when price is between the bands
3. Consider profits when approaching red resistance (band position > 80%)
4. Never panic - the model shows $30K+ is now the permanent floor
Key Metrics to Watch
- **Band Position: <20% = Oversold, >80% = Overbought
- Fair Value: Price above = Overvalued, below = Undervalued
- Support Line: Breaking below suggests model invalidation
Current Cycle Projections
Based on the November 2022 bottom at ~$15,500:
- Cycle Peak: ~$155,000-$230,000 (October 2025)
- Next Bottom: ~$70,000-$100,000 (October 2026)
- Long-term: $1 million by 2033 (power law projection)
Customizable Settings
Model Parameters
- Intercept & Slope: Fine-tune the power law formula
- Band Offsets: Adjust support/resistance distances
Display Options
- Toggle each visual element on/off
- Show/hide future projections
- Enable/disable cycle analysis
- Customize halving markers
Understanding the Math
The model uses the formula: **Price = 10^(A + B × log10(days since genesis))**
Where:
- A = -17.01 (intercept)
- B = 5.82 (slope)
- Days counted from Bitcoin's genesis block (Jan 3, 2009)
This creates parallel support/resistance lines in log-log space that have contained Bitcoin's price for 15+ years.
Important
1.Not Financial Advice: This is a mathematical model, not a guarantee
2. Long-term Focus: Best suited for macro analysis, not day trading
3. Model Limitations: Past performance doesn't ensure future results
4. Volatility Expected: 50-80% drawdowns are normal within the model
Background
Dr. Giovanni Santostasi discovered this model while analyzing Bitcoin through the lens of physics. He found that Bitcoin behaves more like a city or organism than a financial asset, growing according to universal power laws found throughout
開源腳本
本著TradingView的真正精神,此腳本的創建者將其開源,以便交易者可以查看和驗證其功能。向作者致敬!雖然您可以免費使用它,但請記住,重新發佈程式碼必須遵守我們的網站規則。
免責聲明
這些資訊和出版物並不意味著也不構成TradingView提供或認可的金融、投資、交易或其他類型的意見或建議。請在使用條款閱讀更多資訊。
開源腳本
本著TradingView的真正精神,此腳本的創建者將其開源,以便交易者可以查看和驗證其功能。向作者致敬!雖然您可以免費使用它,但請記住,重新發佈程式碼必須遵守我們的網站規則。
免責聲明
這些資訊和出版物並不意味著也不構成TradingView提供或認可的金融、投資、交易或其他類型的意見或建議。請在使用條款閱讀更多資訊。