PROTECTED SOURCE SCRIPT
Nifty VWAP
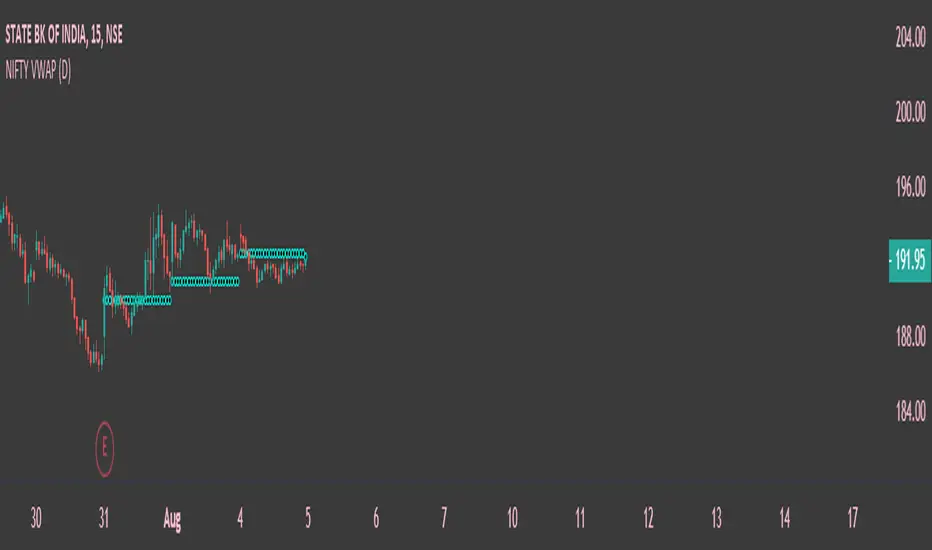
This indicator is based on Indian Indices Nifty and Nifty 50 Stocks . Combination of breadth volumes of Niifty50 stocks to get Nifty Volume , can be used only Nifty50 Index and stocks . This indicator tells you the trend of the index or stocks. If the price is above the Volume weighted average price line its considers as Bullish Trend and if the price is below the Volume weighted average price line its considered as Bearish Trend. Default resolution is Set as Day , can be customized according to ones choice . Hope you guys will like it .
受保護腳本
此腳本以閉源形式發佈。 不過,您可以自由使用,沒有任何限制 — 點擊此處了解更多。
免責聲明
這些資訊和出版物並非旨在提供,也不構成TradingView提供或認可的任何形式的財務、投資、交易或其他類型的建議或推薦。請閱讀使用條款以了解更多資訊。
免責聲明
這些資訊和出版物並非旨在提供,也不構成TradingView提供或認可的任何形式的財務、投資、交易或其他類型的建議或推薦。請閱讀使用條款以了解更多資訊。