PROTECTED SOURCE SCRIPT
FX Rotation Dashboard – FX vs DXY
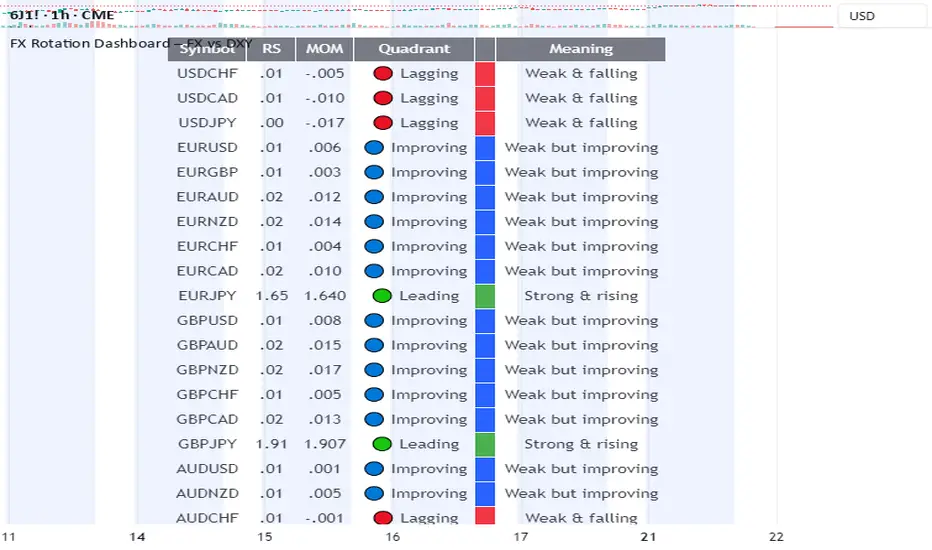
FX Rotation Dashboard
This FX Rotation Dashboard indicator offers a clear, at-a-glance overview of the relative strength and momentum of major FX pairs when measured against the US Dollar Index (DXY). It helps identify which currency pairs are leading or lagging in performance and how their relative positioning is evolving over time.
🔎 Structure
Each row in the table represents a currency pair and provides the following data:
Symbol: The FX pair (e.g., EURJPY, GBPUSD, AUDNZD)
RS: The current relative strength ratio vs. DXY
MOM: The momentum of the RS – showing whether strength is accelerating or decelerating
Quadrant:
🔴 Lagging: Underperforming and losing momentum
🔵 Improving: Underperforming but gaining momentum
🟢 Leading: Outperforming with rising momentum
🟡 Weakening (not visible in current table): Outperforming but slowing down
Meaning: A descriptive label summarizing the quadrant status
🧭 Interpretation
Currency pairs in the Leading quadrant (e.g., EURJPY, GBPJPY, CHFJPY, CADJPY) are currently outperforming the USD with rising momentum – often indicating strength across both RS and MOM dimensions.
Pairs in the Improving quadrant (e.g., GBPUSD, EURUSD, AUDUSD) are showing positive momentum but still lagging in relative strength – potential early signs of rotation into leadership.
Pairs in the Lagging quadrant (e.g., USDCHF, USDJPY, AUDCHF) are underperforming and continue to weaken – often considered the least attractive at the current stage of the cycle.
🧠 Purpose
This FX Rotation visualization is particularly useful for:
Macro-level FX rotation analysis
Spotting emerging trends before they are fully priced in
Tracking performance of G10 and cross pairs against USD
It provides context for currency strength beyond individual price movements by placing them in a relative performance framework.
⚠️ Disclaimer: This indicator is for informational and analytical purposes only. It does not constitute investment advice or a recommendation to buy or sell any financial instrument. Always conduct your own research before making trading decisions.
受保護腳本
此腳本以閉源形式發佈。 不過,您可以自由使用,沒有任何限制 — 點擊此處了解更多。
免責聲明
這些資訊和出版物並非旨在提供,也不構成TradingView提供或認可的任何形式的財務、投資、交易或其他類型的建議或推薦。請閱讀使用條款以了解更多資訊。
受保護腳本
此腳本以閉源形式發佈。 不過,您可以自由使用,沒有任何限制 — 點擊此處了解更多。
免責聲明
這些資訊和出版物並非旨在提供,也不構成TradingView提供或認可的任何形式的財務、投資、交易或其他類型的建議或推薦。請閱讀使用條款以了解更多資訊。