OPEN-SOURCE SCRIPT
UCS_S_Steve Primo - Strategy #8
Hello Fellas,
Hope you are trading fantastic and fine. Here is another setup from Steve Primo (Stocks) Setups. He claims this can be applied on any market, and you can. Primarily focused on Stocks and Futures market.
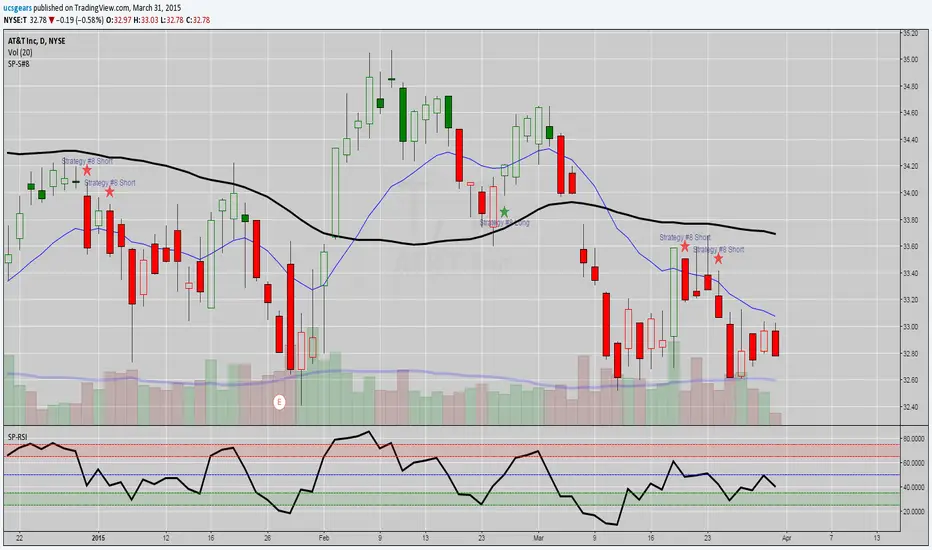
NOTE : I DID CODE THE BOTTOM INDICATOR, NOT PUBLISHING IT, ITS JUST RSI(5)
What did I change, ofcourse I don't publish what I find, There is a bit of me in the codes.....
1. Setup only shows up at meaningful levels, Stringent Filter
Myself and tradearcher will keep this upto date. As he has volenteered to help with the track record of steve primo strategies.
docs.google.com/spreadsheets/d/1I-BLZGJl612g3a8UoWhtRhdF1ECgM49djVbf5TQIHsM/edit?usp=sharing
This is more like catching a freight train after a mini pullback.
AGAIN, This is not a holy grail, but this fits my personality of trading, Buying pullbacks on stronger stocks. Because it is harder to get a UCS_momo_Oscillator to signal a setup, primarily because of the smoothing, you can use this as an alternative to catch the excitement trade.
Do not sit on it for more than T+4 days, Unless another setup triggered in your way.
Rule - Buy/Sell the candle breakout next day after the setup - in the direction it is setting up
- Close the Position @ 100% candle extension or RSI Oversold.
Hope you are trading fantastic and fine. Here is another setup from Steve Primo (Stocks) Setups. He claims this can be applied on any market, and you can. Primarily focused on Stocks and Futures market.
NOTE : I DID CODE THE BOTTOM INDICATOR, NOT PUBLISHING IT, ITS JUST RSI(5)
What did I change, ofcourse I don't publish what I find, There is a bit of me in the codes.....
1. Setup only shows up at meaningful levels, Stringent Filter
Myself and tradearcher will keep this upto date. As he has volenteered to help with the track record of steve primo strategies.
docs.google.com/spreadsheets/d/1I-BLZGJl612g3a8UoWhtRhdF1ECgM49djVbf5TQIHsM/edit?usp=sharing
This is more like catching a freight train after a mini pullback.
AGAIN, This is not a holy grail, but this fits my personality of trading, Buying pullbacks on stronger stocks. Because it is harder to get a UCS_momo_Oscillator to signal a setup, primarily because of the smoothing, you can use this as an alternative to catch the excitement trade.
Do not sit on it for more than T+4 days, Unless another setup triggered in your way.
Rule - Buy/Sell the candle breakout next day after the setup - in the direction it is setting up
- Close the Position @ 100% candle extension or RSI Oversold.
開源腳本
本著TradingView的真正精神,此腳本的創建者將其開源,以便交易者可以查看和驗證其功能。向作者致敬!雖然您可以免費使用它,但請記住,重新發佈程式碼必須遵守我們的網站規則。
Uday C Santhakumar
免責聲明
這些資訊和出版物並不意味著也不構成TradingView提供或認可的金融、投資、交易或其他類型的意見或建議。請在使用條款閱讀更多資訊。
開源腳本
本著TradingView的真正精神,此腳本的創建者將其開源,以便交易者可以查看和驗證其功能。向作者致敬!雖然您可以免費使用它,但請記住,重新發佈程式碼必須遵守我們的網站規則。
Uday C Santhakumar
免責聲明
這些資訊和出版物並不意味著也不構成TradingView提供或認可的金融、投資、交易或其他類型的意見或建議。請在使用條款閱讀更多資訊。